Figure 4.

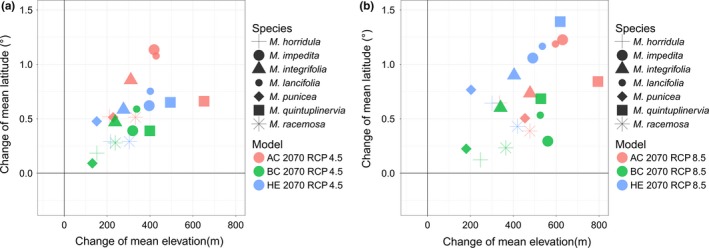
Changes in mean elevation and mean latitude for every species under (a) RCP 4.5 and (b) RCP 8.5 scenarios, with models displayed in different colors and species in different shapes

Changes in mean elevation and mean latitude for every species under (a) RCP 4.5 and (b) RCP 8.5 scenarios, with models displayed in different colors and species in different shapes