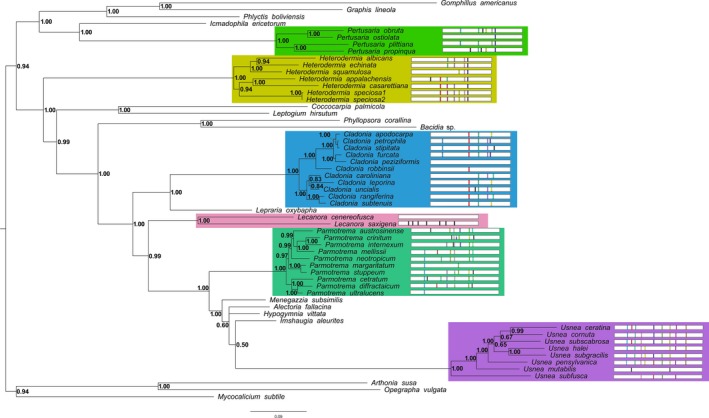
Figure 1.

Fifty percent majority rule consensus tree from Bayesian analysis, with posterior probabilities mapped at each node. Tree rooted using Artonia susa, A. ruana, and Opegrapha vulgata.Genera for which multiple species were sampled are demarcated with colored boxes. To the right of each species is a cartoon representation of intron presence and location within the cox1gene. Sequence similarity between introns is represented by unique colors. A black‐colored intron indicates a unique, likely derived intron for that species. Introns are colored to indicate sequence similarity within a single genus (i.e., blue in one genus is not the same intron as blue in other genera)
