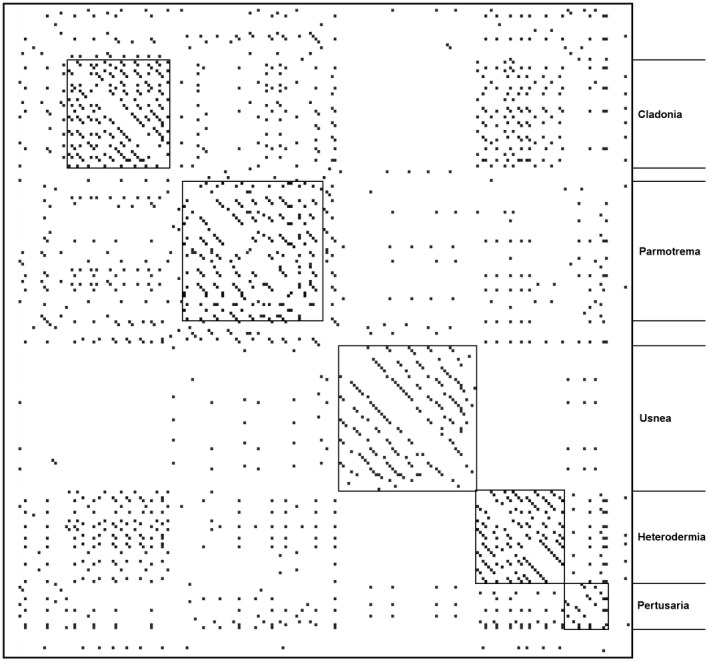
Figure 2.

Pairwise similarity matrix of the resulting bit score from comparison between introns in the cox1gene of each species that was present within a genus here represented by two or more species (rows and column each represent unique introns). Matrix represents a nucleotide all‐versus‐all BLASTn (diagonal values representing identical comparisons omitted). Gray scale is weighted by bit score (measure of sequence similarity and number of bp that are similar); darker colors indicate higher bit score. Within‐species comparisons are demarcated by boxes, and genus is noted on right‐hand side of figure.
