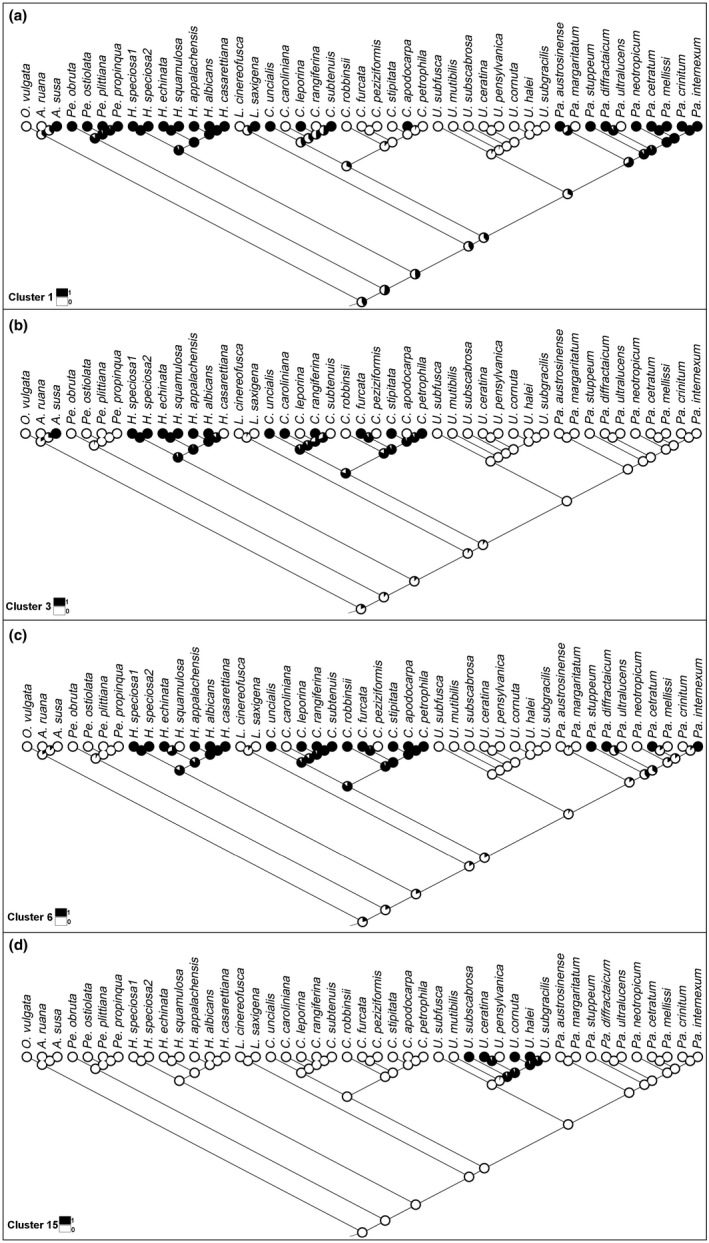
Figure 4.

Ancestral state reconstruction for four of the nineteen intron clusters (these clusters were chosen to demonstrate early and late intron gains): clusters 1 (a), 3 (b), 6 (c), and 15 (d; see Figure 3 for cluster identification). Pies at nodes represent likelihoods that a given intron cluster was (black) or was not (white) present at ancestral node. Tree shows only species having introns with sequence homology to other species (see text for further explanation)
