Figure 4.

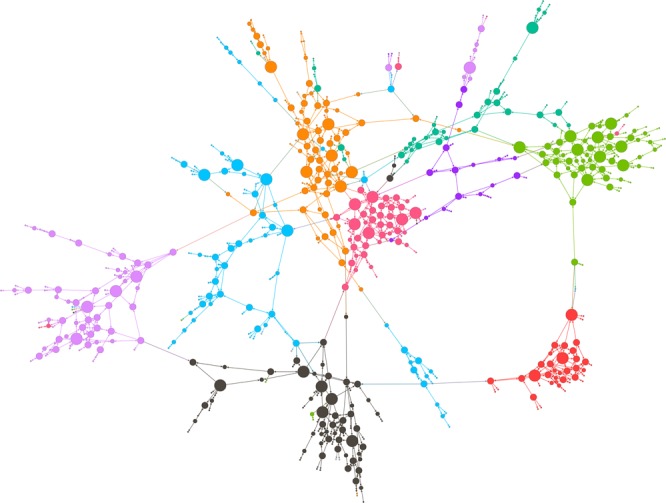
Complete social network that visualizes participants in the brokerage position. The size of the vertex indicates the amount of the individual’s opportunity for brokerage. The different colors represent different Ri.

Complete social network that visualizes participants in the brokerage position. The size of the vertex indicates the amount of the individual’s opportunity for brokerage. The different colors represent different Ri.