Figure 1.
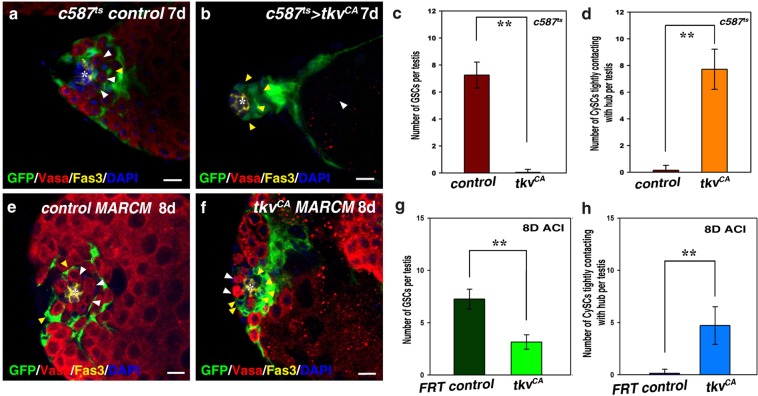
Ectopic expression of tkvCA in CySCs leads to GSC loss. (a) c587ts control testis. GSCs (white arrowheads) and CySCs (yellow arrowhead) are indicated. (b) c587ts > tkvCA testis. The hub is surrounded by CySCs (yellow arrowheads), and no germline cells can be observed (white arrowhead). (c) Quantification of the number of GSCs per testis in control and c587ts > tkvCA testes. n = 10–15 testes. (d) Quantification of the number of CySCs with their cell body attaching to the hub in control and c587ts > tkvCA testes. n = 10–15 testes. (e) CySC MARCM clones in FRT control. GSCs (white arrowheads) and GFP-marked CySCs (yellow arrowhead) are indicated. (f) tkvCA-expressing CySC MARCM clones. Some GFP-marked tkvCA CySCs (yellow arrowheads) tightly attach to the hub, and the number of GSCs per testis is greatly reduced (white arrowhead). (g) Quantification of the number of GSCs per testis in testes carrying FRT control and tkvCA MARCM clones. n = 10 testes. (h) Quantification of the number of CySCs with their cell body attaching to the hub in testes carrying FRT control and tkvCA MARCM clones. n = 10 testes. mean ± SEM is shown. **p < 0.01. GFP in green, Vasa in red, Fas3 in yellow, blue indicates DAPI staining for DNA. Scale bars: 10 μm.

