Figure 2.
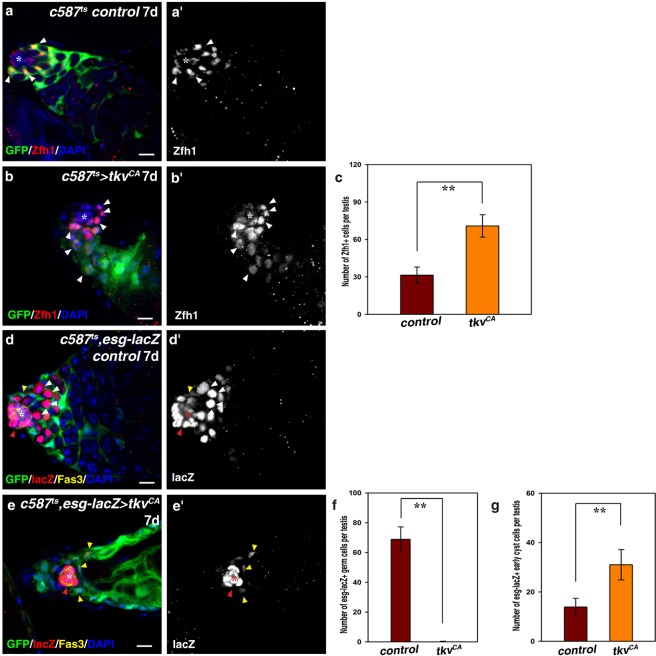
Ectopic expression of tkvCA in CySCs leads to CySC overproliferation and CySC-GSC competition. (a) CySCs (by Zfh1, red, white arrowheads) in c587ts control testis. (b) CySCs (white arrowheads) in c587ts > tkvCA testis. (c) Quantification of the number of Zfh1+ cells in control and c587ts > tkvCA testes. n = 10–15 testes. (d) esg-lacZ (by lacZ, red) in c587ts control testis. esg-lacZ is highly expressed in the hub (red arrowhead and asterisk) and the early germline cells (GSCs and GBs) (white arrowheads), and weakly expressed in CySCs (yellow arrowhead). (e) esg-lacZ (red) in c587ts > tkvCA testis. No germline cells can be observed. esg-lacZ can only be observed in the hub (red arrowhead and asterisk) and CySCs (yellow arrowheads). (f) Quantification of the number of esg-lacZ+ germline cells in control and c587ts > tkvCA testes. n = 10–15 testes. (g) Quantification of the number of esg-lacZ+ early cyst cells in control and c587ts > tkvCA testes. n = 10–15 testes. mean ± SEM is shown. **p < 0.01. GFP in green, blue indicates DAPI staining for DNA. Scale bars: 10 μm.

