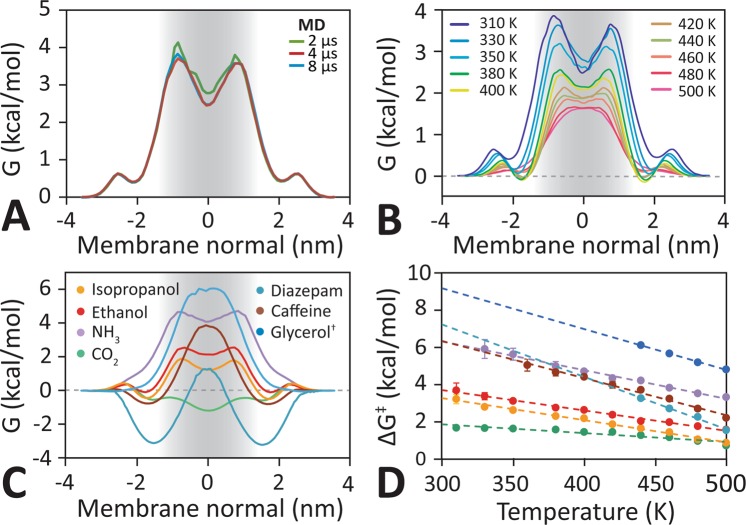
Figure 1.
Trans-bilayer free energy barrier profile. (A) Free energy profiles for ethanol within the apical hBMEC lipid bilayer in 310 K obtained from unbiased equilibrium simulations with different trajectory timescales. The free energy profile converges after 4 μs. (B) Free energy profiles for ethanol in apical hBMEC lipid bilayers assembled from series of unbiased equilibrium molecular dynamics (MD) simulations with different temperatures ranging from 310 K to 500 K. (C) Glycerol and ethosuximide free energy profiles were calculated from the transmembrane solute distribution at 440 K, all other compounds were calculated at 380 K. The shape of the barrier profile is determined by the chemistry of the molecule, with no clearly recognizable pattern for small (CO2, NH3), polar (NH3, ethanol, isopropanol), or large (isopropanol, caffeine, ethosuximide) molecules. (D) The main barrier height decreases linearly with increasing temperature for all molecules. This finding allows the estimation of the barrier height using elevated temperature simulations.

