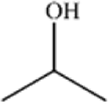
Table 2.
Comparison of trans-bilayer permeabilities derived from MD simulations (PSim) with permeabilities measured using an experimental transwell assay (Papp).
| Name | Structure | Papp (cm/s) | Psim (cm/s) |
|---|---|---|---|
| Carbon -dioxide | O=C=O | 1.6 ± 0.4 × 10⁻¹ | 1.5 ± 0.1 × 10⁻¹ |
| Ethanol |
|
2.1 × 10⁻³ | 9.3 ± 0.6 × 10⁻³ |
| Isopropanol |

|
6.5 × 10⁻³ | 2.0±1.1 × 10⁻² |
| Caffeine |

|
2.1 ± 1.2 × 10⁻⁵ | 6.2 ± 3.5 × 10⁻⁵ |
| Ethosuximide |

|
9.7 × 10⁻⁶ | 1.0 ± 2.1 × 10⁻⁵ |
| Glycerol |

|
9.5 × 10⁻⁶ | 3.2 ± 1.7 × 10⁻⁶ |
| Ammonia | NH3 | 2.7 × 10⁻³ | 8.10 × 10⁻⁴ |
Values for Papp were obtained from experimental studies. Papp for CO2 was obtained from the rate constant (km) for transport across a supported lipid bilayer at room temperature (Papp = km/2) (Gutknecht et al.)39. Papp for ethanol and isopropanol were obtained from the rate constants (km) for transport into red blood cells (Papp = km/2) (Brahm et al.)40. Papp for caffeine was obtained as part of this work from transwell measurements using stem-cell derived hBMECs (see Supplementary Information for details). Papp for ethosuximide was obtained from transwell measurements using MDCKII cells (Summerfield et al.)32. Papp for glycerol was obtained from transwell measurements using bovine BMECs (Shah et al.)33. Papp for NH3 was obtained from basolateral and apical membrane of principal cells (PCs) and intercalated cells (ICs) in perfused rabbit cortical collecting ducts (CCDs)41.
