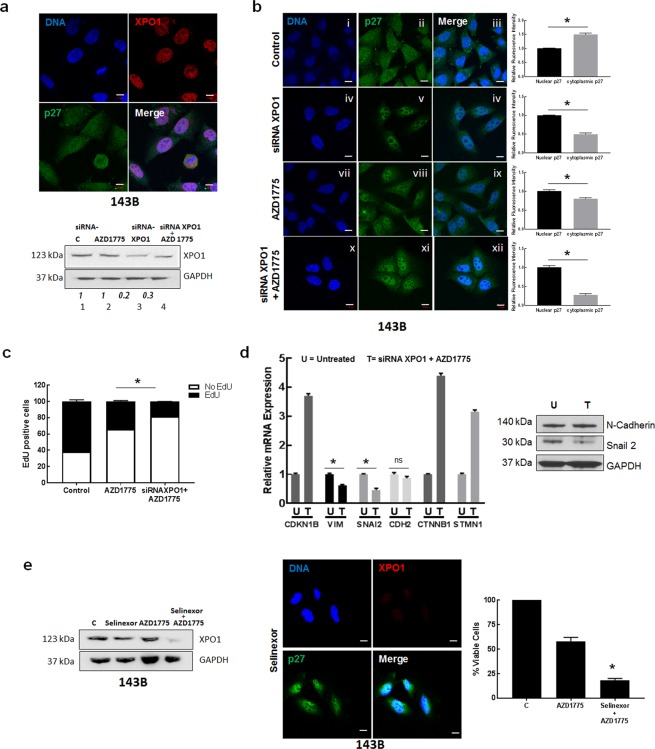
Figure 5.
Nuclear localization and upregulation of p27 expression decrease osteosarcoma cell proliferation in vitro. (a) Upper panel: A. 143B cells were subjected to immunofluorescence staining using anti-XPO1 and anti-p27 antibodies. p27 is colored green; XPO1 is colored red; nuclei were stained with Hoechst dye and are colored blue. Magnification is 63x; scale bars = 10 μm. Lower panel: Immunoblot analysis of lysates extracted from 143B cells treated with AZD1775, siRNAXPO1 or both agents combined with anti-XPO1 antibody. GAPDH was the loading control. (b) Immunofluorescence staining of 143B cells was performed with anti-p27 antibody. p27 is colored green; nuclei are stained with Hoechst dye and colored blue. The merged panel shows nuclear and cellular localization of p27. Magnification is 63x; scale bars = 10 μm. Right plots: Relative intensities of nuclear and cytoplasmic p27 staining were quantified by Image J. (c) 143B cells were treated as indicated and analyzed using the EdU assay. Cell proliferation plot was generated by determining EdU positive cells. Each column represents EdU positive (black) and negative (white) cells for 100 cells. Data is mean + SE; *represents p < 0.05; n = 3 replicates. (d) Left: Total RNA was extracted from siRNAXPO1 + AZD1775 treated 143Bcells (T) treated cells and mRNA levels of selected metastasis genes were measured by qRT-PCR. Results are quantified relative to untreated controls (U). Statistical significance was measured by a two-sided t-test. Right: Immunoblot analysis of lysates extracted from 143B cells treated siRNAXPO1 + AZD1775 using anti-N-Cadherin and anti-Snail-2 antibody. GAPDH was loading control. (e) Left: Immunoblot analysis of lysates extracted from 143B cells treated with Selinexor, AZD1775, and both agents combined (Selinexor + AZD1775). GAPDH was the loading control. Middle: Immunofluorescence staining of 143B treated with Selinexor cells was performed with anti-p27 antibody. p27 is colored green; nuclei are stained with Hoechst dye and colored blue. The merged panel shows nuclear and cellular localization of p27. Magnification is 63x; scale bars = 10 μm. Right: Cell viability of 143B cells incubated with the indicated drug treatment was measured using the cell titer blue assay. Data is shown as mean + SE; *represents p < 0.05; n = 6.

