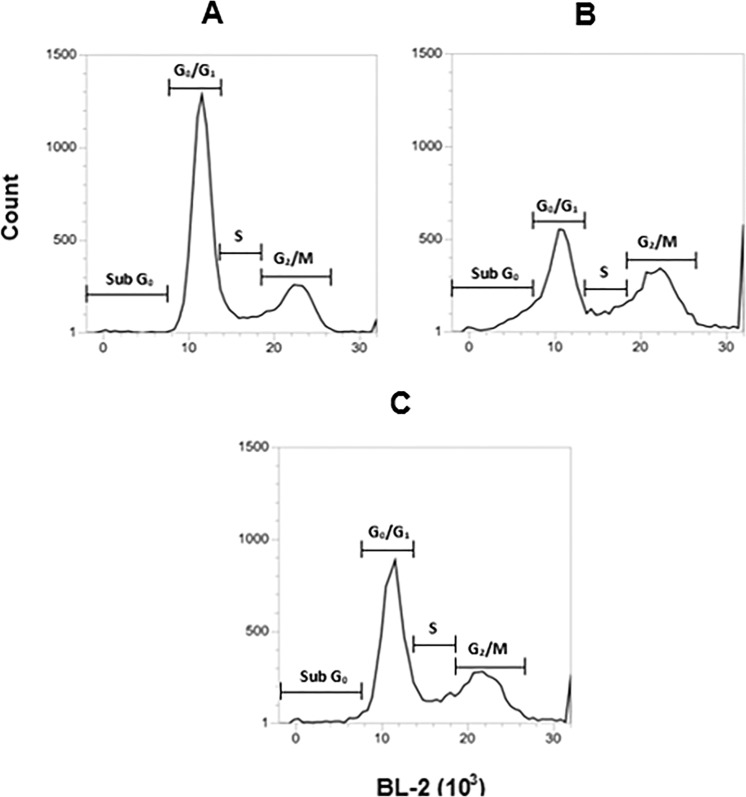
Figure 5.
Evaluation of cell cycle progression in L. (L.) infantum promastigotes treated with compound 2 (190 μM) by flow cytometry (488 nm excitation and 574 nm emission). Propidium iodide fluorescence was arranged in histograms. Untreated promastigotes and treated with miltefosine (25 μM) were employing to achieve minimal and maximal depolarization, respectively. A representative experiment is shown. (A) Untreated control, (B) miltefosine, and (C) compound 2. Sub G0: represent cells with fragmented DNA, cell death; G0/G1: diploid cells (2N); S: DNA replication; G2/M: cells with duplicate DNA content.

