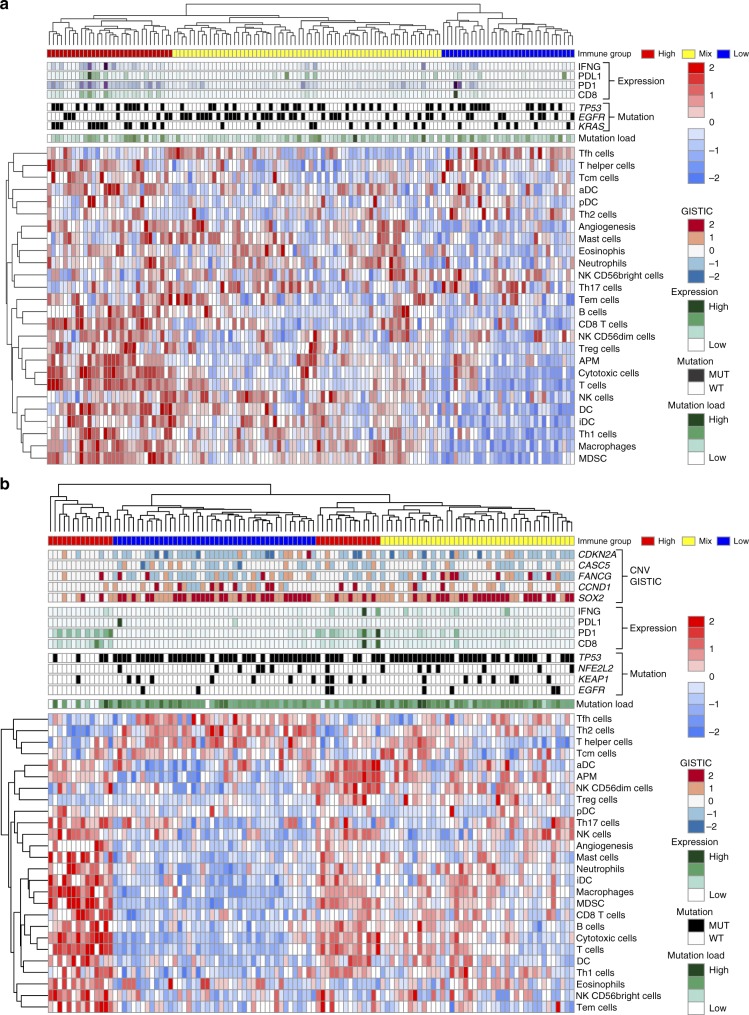
Fig. 4.
Characterization of immune infiltration in the CHOICE population. a Heat map of normalized ssGSEA score for ADC, mutation status of TP53, KRAS, and EGFR are shown while CNV level of CASC5, FANCG, CDKN2A, CCND1, and SOX2 are shown. b Heat map of normalized ssGSEA for SQCC. Mutation status of TP53, NFE2L2, KEAP1, and EGFR are shown, while CNV profile of CDKN2A, CASC5, FANCG, CCND1, and SOX2 are shown. Tumor samples were classified into 3 immune status: HIGH, MIX, and LOW based on the signature score of 26 immune cell types. Samples were also labeled using 5 types of omics data. (1) Mutation burden for each sample (green). (2) Immune status (red, yellow, and blue for HIGH, MIX, and LOW). (3) Selected significantly mutated genes in each subtype (black for mutation and white for wild-type). (4) mRNA expression value for four immune marker genes (IFNG, PDL1, PD1, and CD8) (dark green indicates high expression and light green indicate low expression). (5) GISTIC 2 based CNV for the selective gene. Source data are provided as a Source Data file. Dark red color represents homozygous amplification, light red for heterozygous amplification, white for diploid, light blue for heterozygous deletion, and dark blue for homozygous deletion

