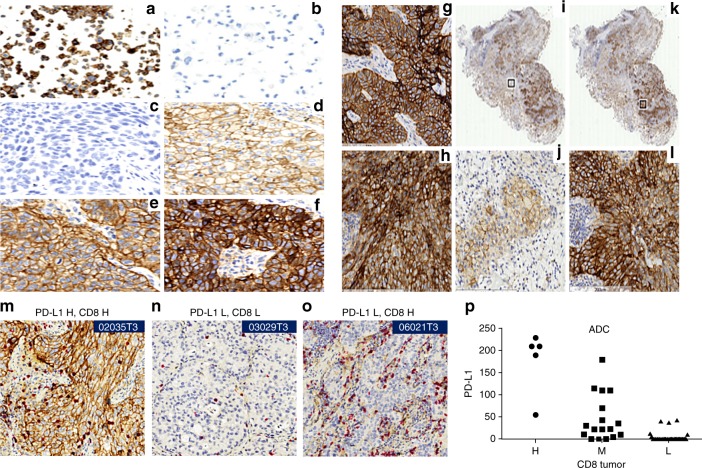
Fig. 6.
Immunohistochemistry staining of PD-L1 and CD8. a Membrane staining (3+) was seen in positive control cells (HDLM-2). b No staining was seen in negative control cells (PC3). c–f Representative images of membrane staining on tumor cells were shown with different signal intensities: c No staining. d Low/1+staining, e Medium/2+staining. f High/3+staining. Example of heterogeneous IHC staining: g Strong staining of PD-L1 from SQCC (h) Strong staining in ADC. i–l Heterogeneous expression of PD-L1 from the same tissue. i, k are the same tissue; two regions are selected (boxed). j Zoomed-in region of i. l Zoomed-in region of k. Correlation between PD-L1 and CD8. m–o Representative images of PD-L1/CD8 both high, both low and PD-L1 L/CD8 H. p Correlation between CD8 positivity and PD-L1 expression was observed in ADC (ANOVA p-value = 8.76e-13, F = 50.25, DF = 2). Source data are provided as a Source Data file

