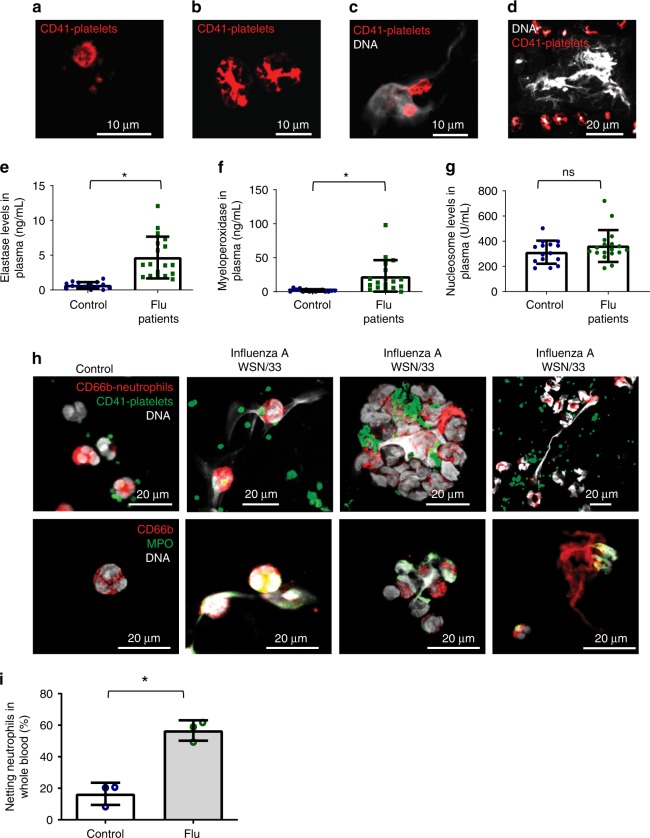
Fig. 1.
Characterization of human blood from influenza-infected patients. a–d Blood from influenza-infected patients was fixed after intravenous collection and stained as described in Methods. In all cases DNA was assessed by DAPI. a Many platelets appeared similar to those observed in control blood from healthy donors with a size of 2–5 µm. b Some platelets from influenza-infected patients had undergone spreading with a distinctive distribution of CD41. c Platelets and platelet microparticles associated with DNA (arrow). d Spread platelets were found surrounding released DNA with distinct DNA content in their center. Of note, blood from influenza-infected patients and controls in (a–d) was not permeabilized. Since formaldehyde can cause certain levels of permeabilization as a function of cross-linking positive staining in control samples for H4 and MPO do not necessarily indicate activation. e–g Levels of proteins related to DNA release in the plasma of influenza-infected patients assessed by ELISA. Source data are provided as a Source Data file. e neutrophil elastase, f myeloperoxidase (MPO), and g histone nucleosome core. The graphs represent the average ± SD of healthy donors (n = 15) and influenza-infected patients (n = 18); significance for (e–g) was assessed by Mann–Whitney U test, star symbol (*) indicates p < 0.0001. h, i To synchronize time of influenza presence as a function of infection and quantify the released DNA, we treated blood from human donors for 30 min with sucrose-purified infectious influenza (WSN/33) at constant rotation and 37 °C. Influenza was used at 1 pfu to 100 platelets. h Representative images of blood from 3 donors with influenza and one (out of 3) healthy control and i their quantitation. Of note, in certain cases the DNA is not entirely covered with platelets, suggesting differences in kinetics of interaction and/or a physiological relationship that needs further in vivo characterization. Data in graph is represented as average ± SD of n = 3 different donors; significance was assessed by unpaired t-test (two-tailed value) and star symbol (*) indicates p = 0.0019, df = 4

