Fig. 6.
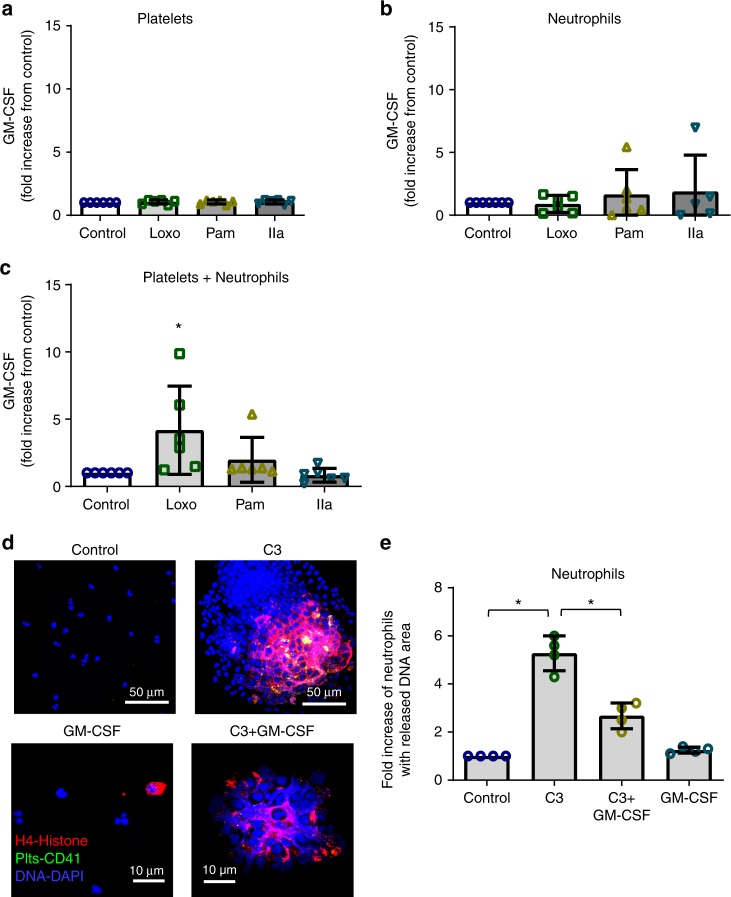
Role of platelet GM-CSF and C3 in neutrophil-DNA release. a–c Isolated human platelets and neutrophils were incubated together or by themselves for 30 min (at constant rotation and 37 °C) in the presence of TLR agonists [TLR7 (Loxo)—1 mM; TLR2 (Pam3CSK4, PAM)—10 μg/μL] or thrombin (IIa)—0.05 U/mL. GM-CSF release from a platelets (p = 0.8903, F = 0.2071, df = 3), b neutrophils (p = 0.7255, F = 0.4422, df = 3), and c platelets and neutrophils incubated together was measured by ELISA (p = 0.0200, F = 4.116, df = 3). The graphs represent the average fold change for each individual of n = 6 (3F; 3M) ± SD. d Confocal images of isolated human neutrophils treated with C3 (30 ng/mL) and neutrophils treated with C3 in the presence of GM-CSF (25 ng/mL). Neutrophils were treated in HEPES-modified Tyrode’s buffer (0.04 × 10⁵ neutrophils/μL) for 30 min at 37 °C, and constant rotation (aggregometer). At the end, cells were fixed and stained [CD41-FITC-platelets (green); H4-AF637-histone (red); DAPI-DNA (blue)]. Neutrophil-DNA aggregates were visualized by confocal microscopy. Images are representatives of n = 4 different donors. C3-treated neutrophils from healthy donors release their DNA and form large aggregates. e Quantitation of (d). The graph (n = 4, 2F, 2M) is represented as average (p < 0.0001, F = 71.42, df = 3) ± SD. Significance in (a–c, e) was assessed using ANOVA followed by Bonferroni multiple comparison test and star symbol (*) indicates p < 0.05. Source data are provided as a Source Data file

