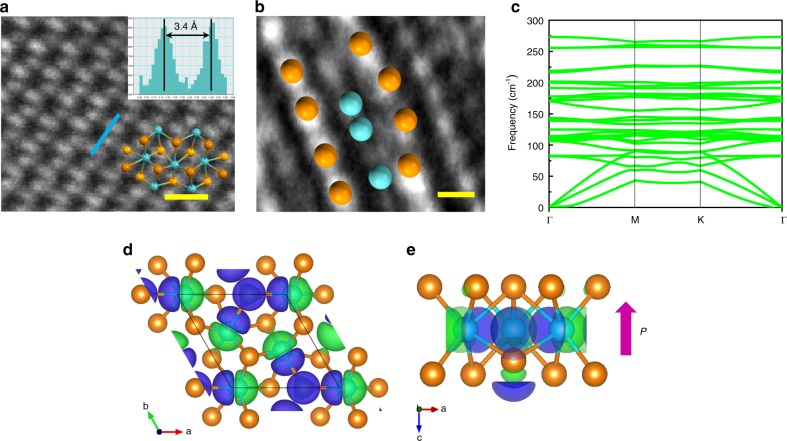
Fig. 3.
Atomic structure and theoretical calculations on ferroelectricity in d1T-MoTe2. a Top-view HRTEM image and intensity profile, the atomic structure of d1T-MoTe2 is placed on top, scale-bar, 0.5 nm. b Atomic structure image of monolayer d1T-MoTe2 and the inset shows atomic structure model (cyan and orange colors represent Mo and Te atoms, respectively), scale-bar, 2 Å. c Phonon dispersion of d1T-MoTe2. d, e Top-view and side-view of charge density difference between ferroelectric d1T and paraelectric 1T phases (green, purple, cyan, orange, and pink colors denote negative charge, positive charge, Mo atom, Te atom, and polarization, respectively)

