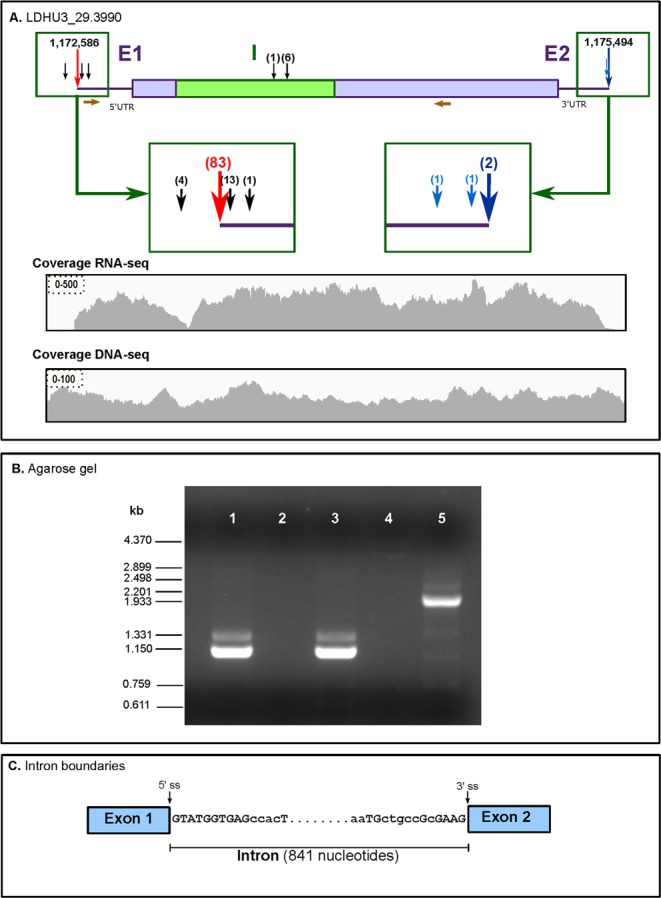
Figure 4.

Processing by cis-splicing of the transcript encoding for the poly-A polymerase in L. donovani. Panel A, gene model for LDHU3_29.3990; E1 and E2, exons; I, intron. The red arrow indicates the position of the main SAS and the alternative SASs are indicated by black arrows (the number of RNA-seq mapped to each SAS is shown in parentheses). Blue arrows point to the poly-A addition sites. SASs mapped in the intron sequence are indicated by arrows above it. The position of the primers used for the PCR amplification are shown (maroon arrows; forward: 5′-GCGAGTTTCT GAAGTGCTGC-3′; reverse: 5′-TTCAGCACTG GGAACAGGTC-3′). The distribution (coverage) of Illumina reads along the region in study obtained after mapping of either RNA-derived reads (coverage RNA-seq) or DNA-derived reads (coverage DNA-seq) are also shown. Panel B, electrophoresis of PCR products on a 1% agarose gel; lanes 1 and 3, PCR amplification using cDNA derived from L. donovani total RNA and using for retrotranscription either SuperScript III (lane 1) or ThermoScript (lane 3) retrotranscriptases; lanes 2 and 4, PCR amplification from L. donovani total RNA (without previous retrotranscription step); lane 5, PCR amplification from L. donovani total DNA. Relative migration and size of molecular weight markers (Φ29 DNA digested with HindIII) are shown on the left. Uncropped gel shown in Supplementary Information Fig. S12. Panel C, schematic representation of the exon-intron junctions as determined after sequencing of the RT-PCR amplicon. Conserved nucleotides (upper case) in the equivalent intron existing in the gene coding for poly-A polymerase in T. brucei86. The positions of 5′ and 3′ splice sites (5′ ss and 3′ ss, respectively) are indicated.
