Figure 4.
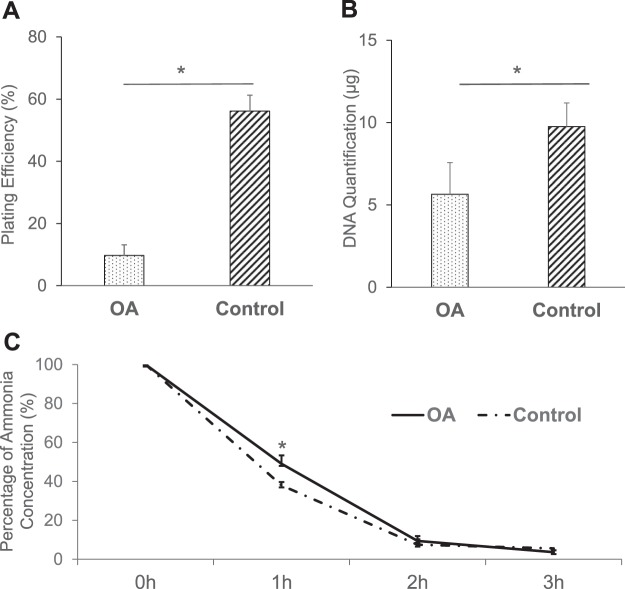
Evaluation of the hepatocyte viability and function in the apoptosis model by conventional assays. (A) PE of the OA (dotted bar, 9.72 ± 3.43%, n = 8) and control groups (left hatched bar, 56.13 ± 5.11%, n = 8). *P < 0.001 in OA vs. control. (B) DNA quantity at 5 days after the plating of the OA (dotted bar, 5.65 ± 1.92 μg, n = 8) and control groups (left hatched bar, 9.76 ± 1.43 μg, n = 8). *P < 0.001 in OA vs. control. (C) The remaining ammonia concentration at 1, 2 and 3-h in the OA (solid line, 49.0 ± 7.22, 9.43 ± 4.34 and 3.66 ± 2.45%, respectively, n = 8) and control groups (dashed line, 37.91 ± 4.06, 7.47 ± 1.77 and 5.60 ± 2.76%, respectively, n = 8). *P < 0.001 at 1-h in OA vs. control.

