
Figure 4.
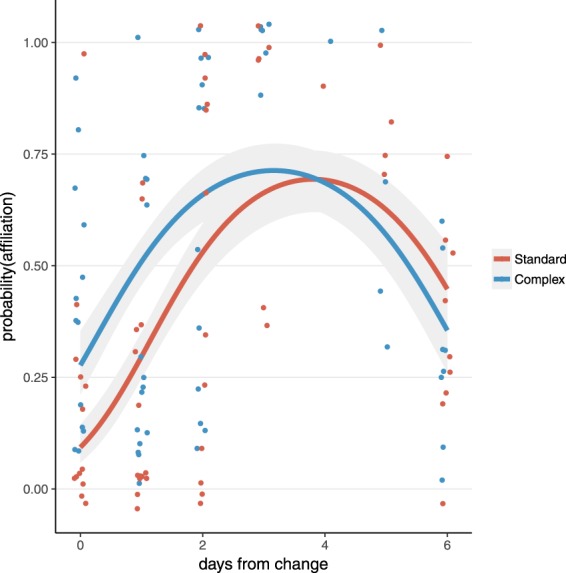
Affiliative behaviours by housing system across the week. The likelihood of observing affiliative behaviour was lower in the standard system vs. the complex system directly after cage-change and followed a quadratic pattern in both systems across the week. Each dot represents the probability of affiliative behaviour in each cage during an observation session (n = 119 for 12 days × 5 groups × 2 treatments – 1 day of missing data; dots are jittered slightly to avoid overlap); lines and grey shading reflect quadratic fit and 95% confidence interval, respectively.