Fig. 2.
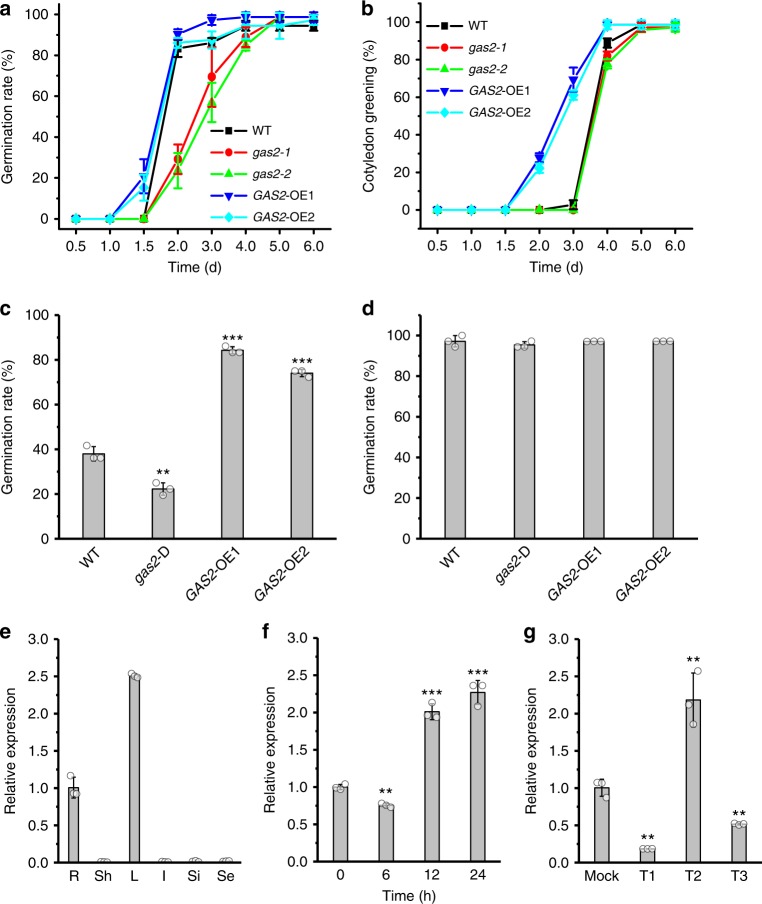
Silencing and overexpression of GAS2 affects seed germination and cotyledon greening. a, b Seed germination and cotyledon greening analysis of wild-type, gas2-1, gas2-2 and two GAS2 overexpression lines (GAS2-OE1 and OE2) grown on MS. Error bars represent SD (standard deviations) (n = 72). c, d Germination analysis of wild-type, noninduced gas2-D and overexpressing GAS2 fresh seeds (not allowed to dry) at the 2-d timepoint after sowing with no stratification (c) and stratification (at the 3-d timepoint after sowing) (d). Error bars represent SD (n = 108). **p < 0.01, ***p < 0.001, t test. e Relative GAS2 mRNA levels in roots (R), shoots (Sh), leaves (L), inflorescences (I), siliques (Si) and seeds (Se) analyzed by RT-qPCR. Error bars represent SD. f Relative GAS2 mRNA levels in hypocotyls of Arabidopsis after different light/dark treatment (dark 9 d, dark 9 d + light 6 h, dark 9 d + light 12 h and dark 9 d + light 24 h). The dark 9-d level was arbitrarily adjusted to 1 and the remaining levels were normalized to that value. Error bars represent SD. **p < 0.01, ***p < 0.001, t test. g Relative GAS2 mRNA levels of the seedlings in response to red and far-red light exposure, analyzed by RT-qPCR. Error bars represent SD. **p < 0.01, t test. Mock: Far red light 0 h; T1: Far red light 2 h; T2: Far red light 2 h + red light 2 h; T3: Far red light 2 h + red light 2 h + Far red light 2 h. Source data are provided as a Source Data file. MS Murashige and Skoog agar

