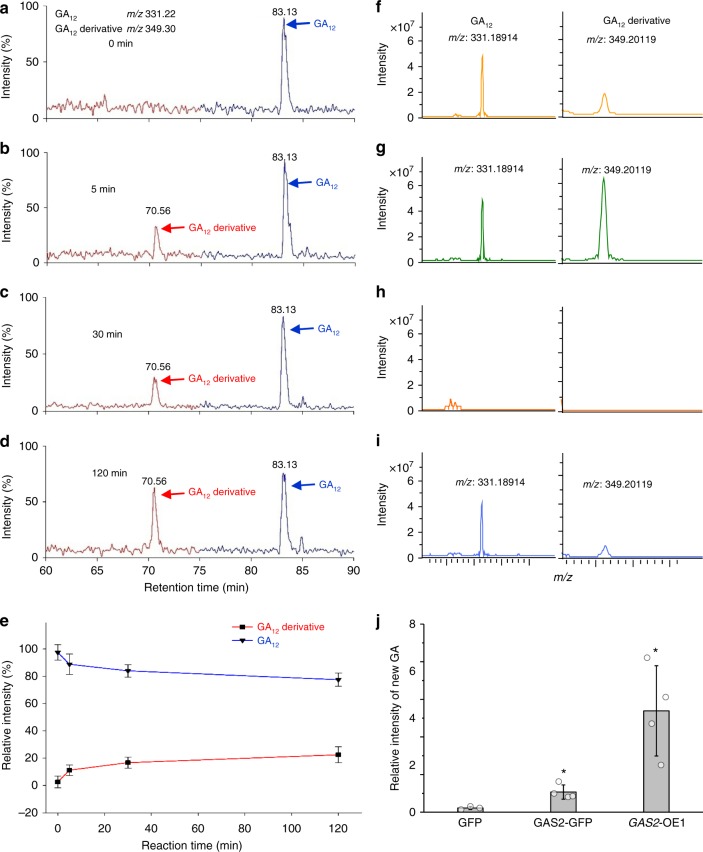
Fig. 3.
Analysis of products produced by the catalytic conversion of GA12 by GAS2 in vivo and in vitro. a–d LC-MS base peak chromatogram of the products generated by the catalytic conversion of GA12 by GAS2 at different time intervals (0, 5, 30, and 120 min). [17,17-2H2]-GA12 was used in this assay. e LC-MS dynamic analysis of GA12 and GA12 derivative in the reaction solution at different time intervals (0, 5, 30, and 120 min). LC-MS liquid chromatography/mass spectrometry. f–i GA12 and GA12 derivative detection using MALDI FTICR-MS spectra in 35S::GAS2-GFP (GAS2-GFP) (f), 35S::GFP (i) transiently transformed in protoplasts and GAS2-OE1 plants (g) with GA12 (2.5 μg/mL), 35S::GFP transiently transformed into protoplasts was used as a negative control without GA12 treatment (h). j Relative intensity of GA12 derivative in Arabidopsis protoplasts transiently transformed with 35S::GAS2-GFP (GAS2-GFP) and 35S::GFP (GFP) overnight. The protoplasts from GAS2-OE1 plants (GAS2-OE1) were used as a control. GA12 (2.5 μg/mL) was supplemented as the substrate for GA12 derivative synthesis catalyzed by GAS2. Values shown are means ± SD (n = 3). *p < 0.05, t test. Source data are provided as a Source Data file

