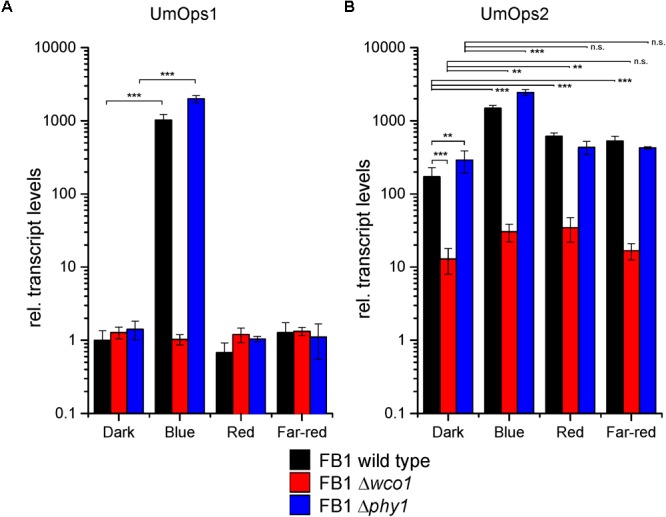
FIGURE 1.

Light regulation of (A) Umops1 and (B) Umops2 expression. Transcript levels were quantified by qRT-PCR. FB1 cells were grown in complete darkness and then illuminated with monochromatic lights at a fluence rate of 10 μmol/m2/s1 for 1 h. Transcript levels were normalized against the one of Umops1 in dark-grown wild type and cyclophilin. Shown are means and SD of three biological replicates kept in darkness or illuminated with either blue (λmax 471 nm), red (λmax 664 nm), or far-red (λmax 740 nm) light as indicated. Significance levels between group samples are indicated for p-values over 0.05 with not significant (n.s.), for <0.05 with one asterisk (∗), for <0.01 with two asterisks (∗∗), and for <0.001 with three asterisks (∗∗∗). Note that relative transcript levels are given in logarithmic scale.
