Figure 1.
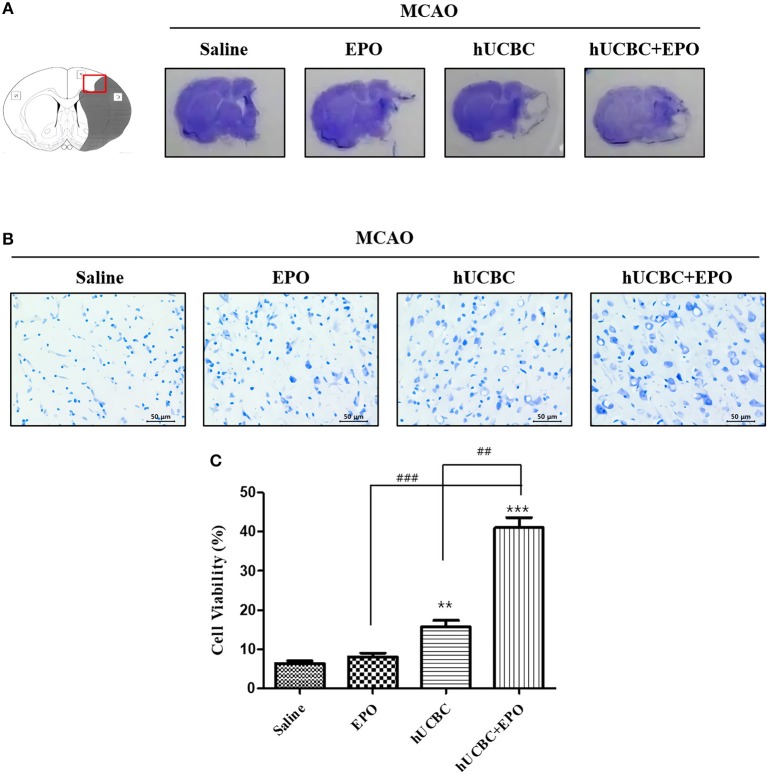
EPO, hUCBC, and hUCBC+EPO attenuated brain damage in MCAO. (A) Gross finding of brain section 28 d after MCAO. (B) Representative images of cresyl violet staining in the cortex (B, scale bar 50 μm). (C) Quantification of the number of neurons in the cortex. Data represent mean ± SEM. N = 3 per group. **P < 0.01, ***P < 0.005 vs. Saline group. ##P < 0.01, ###P < 0.005 for inter-treatment group comparison.

