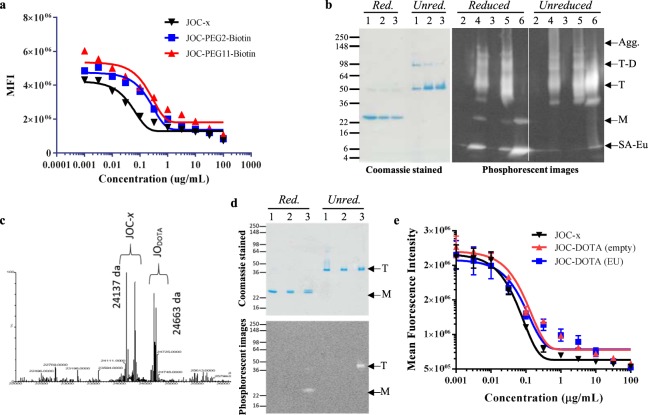
Figure 4.
Conjugation of JOC-x with PEG-biotin or DOTA-EU. Panel (a) Shows the viral inhibition curves for JOC-x before and after conjugating to PEG2- or PEG11-biotin. Panel (b) JOC-x and JOC-Biotin conjugates were mixed with streptavidin-europium (SA-Eu) and resolved by SDS-PAGE with or without boiling or reduction by DTT. One gel was stained with Coomassie to visualize formation of multimers and one gel transferred to a PVDF membrane and imaged using a Spectramax I3x Imager to visualize Eu phosphorescence at an emission spectrum of 616 nm. Multimeric forms are indicated to the right of the gel/blot whereby SA-Eu = free streptavidin-europium, M = Monomer, T = Trimers, T-D = Trimer-Dimers, and Agg. = Aggregates/multimers. Numbering of lanes is as follows: 1 = JOC-x, 2 = JOC-PEG2-biotin, 3 = JOC-PEG11-biotin, 4 = JOC-PEG2-biotin-SA-Eu, 5 = JOC-PEG11-biotin-SA-Eu, 6 = SA-Eu alone. Panel (c) A mass spectrometry spectrum for JOC-DOTA is shown indicating the position of unconjugated JOC-x (24137 Da) and JOC-DOTA (24663 Da). Panel (d) Unconjugated JOC-x (1), JOC-DOTA (empty) (2), and JOC-DOTA (Eu) (3) were resolved by SDS-PAGE, with or without boiling or reduction by DTT. One gel was stained with Coomassie (top gel) to visualize formation of multimers and one gel transferred to a PVDF membrane and imaged using a Spectramax I3x Imager (lower blot) as described. Positions of Trimers “T” and monomers “M” are noted to the right of the gel/blot. Panel (e) Viral inhibition curves of JOC-x, JOC-DOTA (Empty), and JOC-DOTA (Eu) are shown indicating that DOTA-Eu conjugation only minimally reduces DSG2-mediated viral entry.

