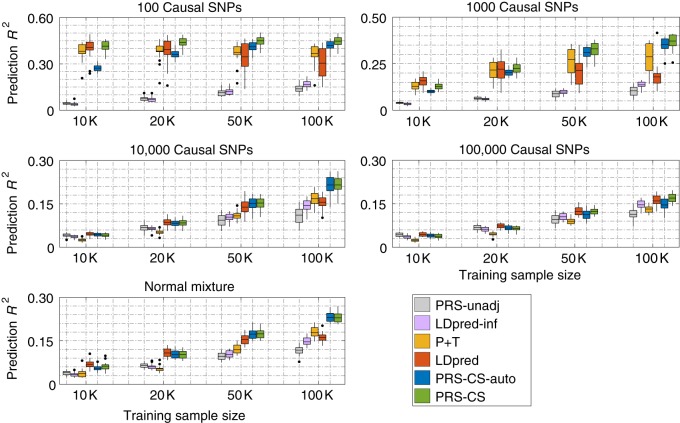
Fig. 1.
Predictive performance of six polygenic prediction methods in simulation studies using a point-normal model and a normal mixture model. Heritability was fixed at 0.5. The 1000 Genomes Project European sample was used as an external linkage disequilibrium (LD) reference panel. Tuning parameters (P-value threshold in P+T, fraction of causal markers in LDpred, and global shrinkage parameter in PRS-CS) were selected in a validation data set. Prediction accuracy was quantified by R2 between the observed and predicted traits in an independent testing set. The upper four panels correspond to the four genetic architectures (100, 1000, 10,000, and 100,000 causal variants) simulated using the point-normal model. The lower panel corresponds to the normal mixture model. Within each panel, results for four different training sample sizes (10,000, 20,000, 50,000, and 100,000) are shown. On each box, the central mark is the mean across 20 simulations, the edges of the box are the 25th and 75th percentiles, the whiskers extend to the most extreme data points that are not considered outliers, and the outliers are plotted individually

