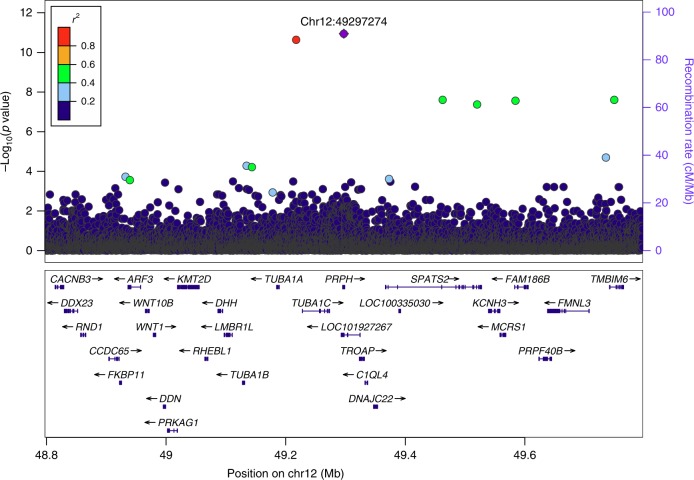
Fig. 1.
Regional association plot for the PRPH splice-donor variant association with SNAP. P values (−log10) of single-nucleotide polymorphism (SNP) associations with SNAP (N = 6879) are plotted against their positions at the 12q13.12 locus. SNPs are colored to reflect their linkage disequilibrium (LD) with rs73112142 (chr12:49297274, purple diamond) in the dataset. The only other marker in the vicinity is an intergenic, highly correlated variant rs532888409 (r2 = 0.93, D′ = 0.97). The right y-axis shows calculated recombination rates at the chromosomal location, plotted as solid gray lines (none in the shown region). Known genes in the region are shown underneath the plot, taken from the UCSC genes track in the UCSC Genome Browser (URLs). All positions are in NCBI Build 38 coordinates. A chi-squared test was used to calculate P values. Source data are provided in a Source Data file

