
Fig. 2.
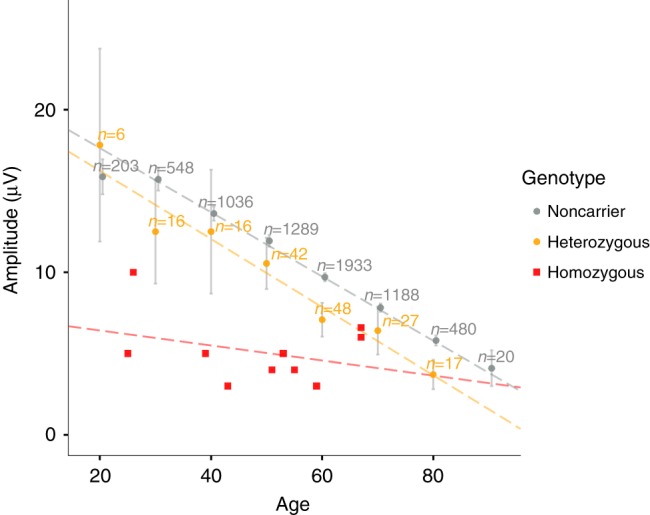
Sural nerve action potential (SNAP, μV) decreases with age (N = 6879). Shown is the mean SNAP per age group among non-carriers (gray dots) and heterozygotes (orange dots). Gray vertical lines represent 95% confidence intervals for the means. The red squares show individual values for the 10 homozygotes. The dotted lines represent results from a linear regression; SNAP (amplitude, μV) = β0 + β1 × Age, for each genotype group. Non-carriers: N = 6697; SNAP = 21.6−0.20 × Age; R2 = 0.19; P = 1.2 × 10−303. Heterozygotes: N = 172; SNAP = 20.4–0.21 × Age; R2 = 0.29; P = 1.9 × 10⁻¹⁴. Homozygotes: N = 10; SNAP = 7.3−0.05 × Age; R2 = 0.12; P = 0.33. Source data are provided in a Source Data file