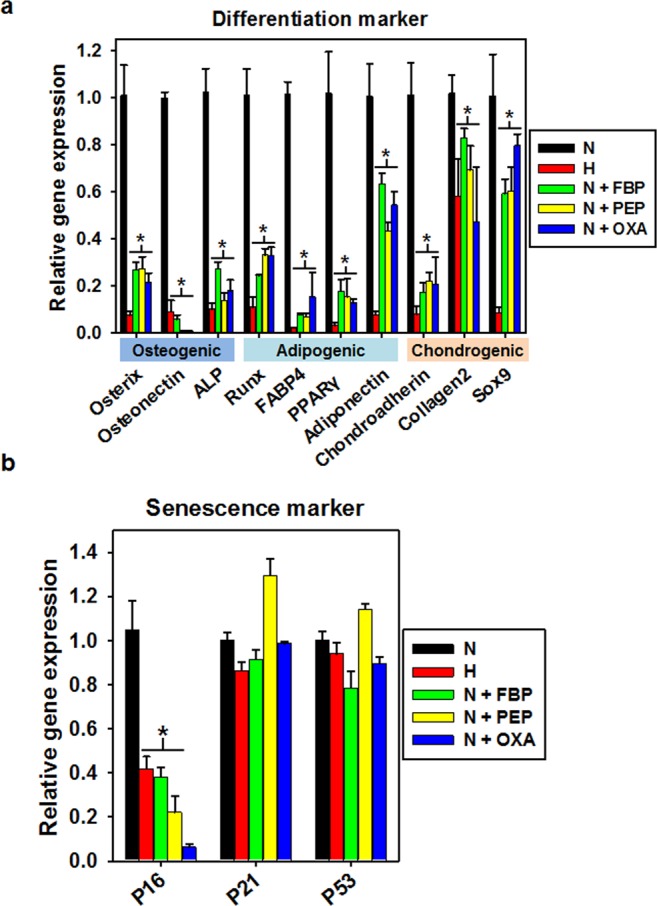
Figure 4.

Downregulation of differentiation markers and senescence marker following metabolite treatment. (a) Gene expression of markers specific for osteogenic, adipogenic, and chondrogenic lineage differentiation after culturing under hypoxic conditions or with the indicated metabolites (FBP, PEP, or OXA). *p < 0.05 as compared with N group; n = 4 per group. (b) Gene expression of markers for senescence after culturing under hypoxic conditions or with the indicated metabolites (FBP, PEP, or OXA). *p < 0.05 as compared with N group; n = 4 per group.
