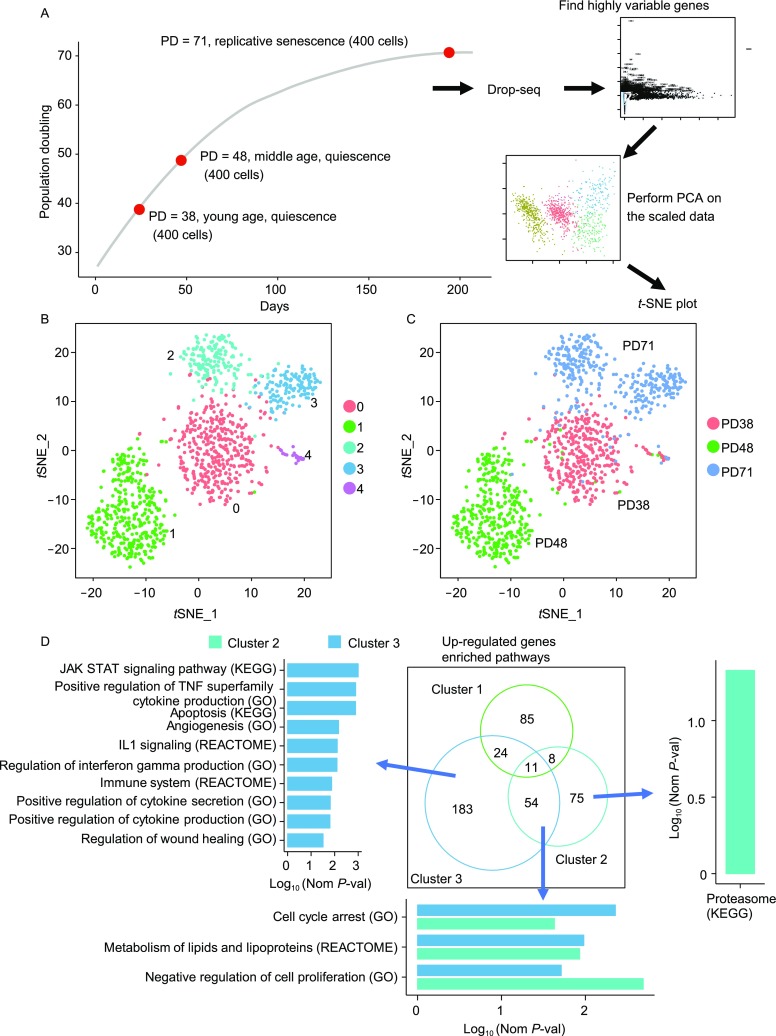
Figure 1.

Change of heterogeneity and transcriptome profile of HCA2 fibroblasts with replicative senescence. (A) Schematic of replicatively senescent HCA2 fibroblast single-cell transcriptomics. (B) t-distributed stochastic neighbour embedding (t-SNE) plot of Drop-seq mRNA sequencing data from PD38 quiescent cells, PD48 quiescent cells and replicatively senescent cells. Cells were clustered into 5 distinct sub-populations. (C) Same as in (B), with cells color-coded by sample of origin. (D) Enriched pathways of up-regulated genes of cluster 1–3, the length and color of the bar show the significance of each cluster’s enriched pathways. Left barplot. Cluster 3-specific enriched pathways of cluster 3’s up-regulated genes. Bottom barplot. Cluster 3 and cluster 2 common enriched pathways of cluster 2’s and cluster 3’s up-regulated genes. Right barplot. Cluster 2-specific enriched pathways of cluster 2’s up-regulated genes
