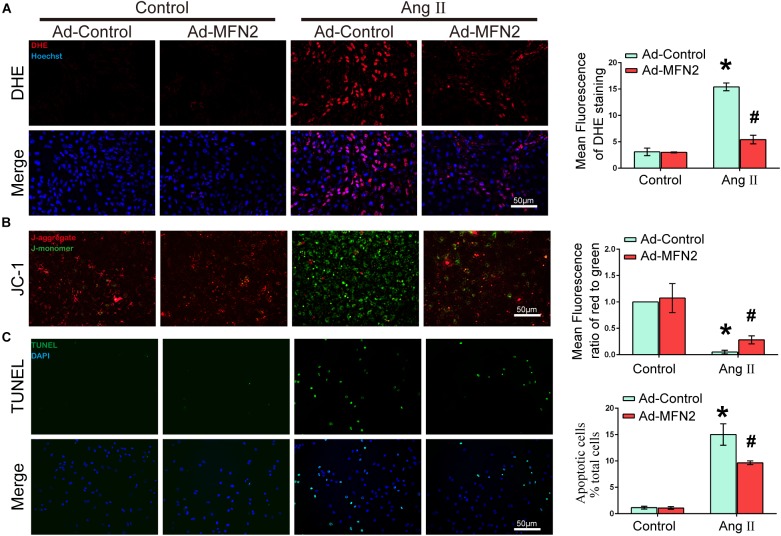
FIGURE 2.
Overexpression of MFN2 prevented Ang II-induced cardiomyocyte injury. Cardiomyocytes were divided into four groups: (1) Control+Ad-Control, cells were transfected with Control Adenovirus and were not treated with Ang II; (2) Control+Ad-MFN2, cells were transfected with MFN2 Adenovirus and were not treated with Ang II; (3) Ang II+Ad-Control, cells were transfected with Control Adenovirus and treated with 1 μM Ang II for 24 h; and (4) Ang II+Ad-MFN2, cells were transfected with MFN2 Adenovirus and treated with 1 μM Ang II for 24 h; (A) DHE staining showing the oxidative stress activity of cardiomyocytes. DHE staining is shown in red, representing ROS production, and Hoechst staining in the nuclei is shown in blue. (B) Fluorescence images of cardiomyocytes stained with JC-1 tracker. J-monomer staining is shown in green, and J-aggregate staining is shown in red. (C) Cells were stained with TUNEL. TUNEL-positive cell is shown in green, and DAPI staining in the nuclei is shown in blue. Data are presented as the means ± SD, (n = 3). ∗P < 0.05 vs. Control+Ad-Control; #P < 0.05 vs. Ang II+Ad-Control.

