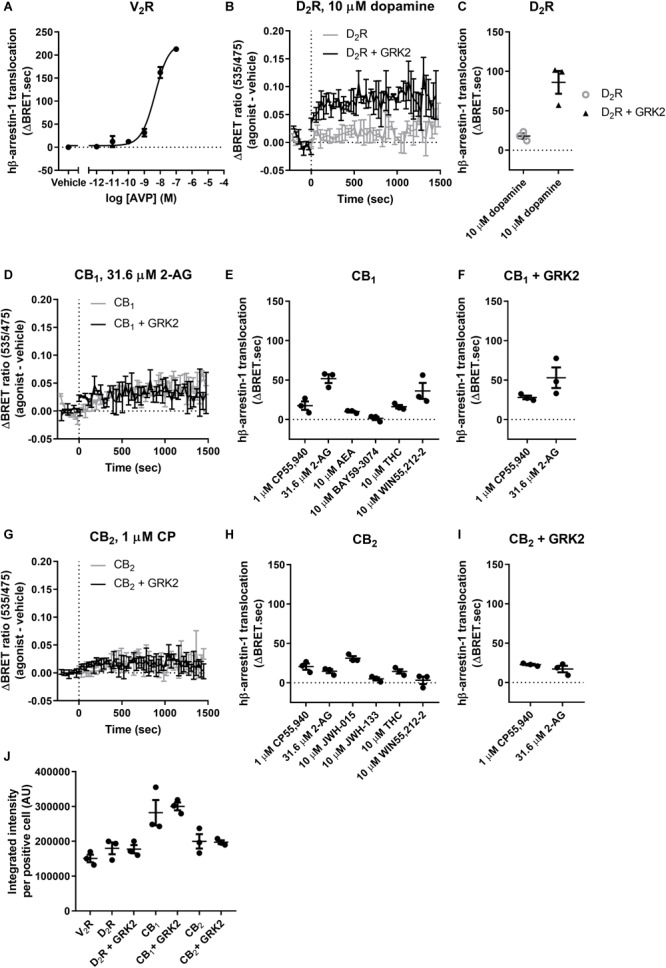
FIGURE 4.

hβ-Arrestin-1 translocation to V2R, D2R, CB1, and CB2. (A) hβ-Arrestin-1 translocation to V2R stimulated with AVP. (B) ΔBRET ratio curves of hβ-arrestin-1 translocation to D2R with or without co-expressed GRK2 stimulated with 10 μM dopamine. (C) AUC quantification of translocation to D2R with or without co-expressed GRK2 stimulated with 10 μM dopamine as shown in B. (D) ΔBRET ratio curves of hβ-arrestin-1 translocation to CB1 with or without co-expressed GRK2 stimulated with 31.6 μM 2-AG. (E) AUC of hβ-arrestin-1 translocation to CB1 stimulated with 1 μM CP55,940, 31.6 μM 2-AG, 10 μM AEA, 10 μM BAY, 10 μM THC, and 10 μM WIN55,212-2. (F) AUC of hβ-arrestin-1 translocation to CB1 with co-expressed GRK2 stimulated with 1 μM CP55,940 and 31.6 μM 2-AG. (G) ΔBRET ratio curves of hβ-arrestin-1 translocation to CB2 with or without co-expressed GRK2 stimulated with 1 μM CP. (H) AUC of hβ-arrestin-1 translocation to CB2 stimulated with 1 μM CP55,940, 31.6 μM 2-AG, 10 μM JWH-015, 10 μM JWH-133, 10 μM THC, and 10 μM WIN55,212-2. (I) AUC of hβ-arrestin-1 translocation to CB2 with co-expressed GRK2 stimulated with 1 μM CP55,940 and 31.6 μM 2-AG. (J) Receptor expression of V2R, D2R, D2R+GRK2, CB1, CB1+GRK2, CB2, and CB2+GRK2 in cells used in experiments (A–G). Receptor expression was quantified in cells positive for expression by ICC. Error bars represent ±standard deviation of representative data with three technical replicates (A, B, D, G) or standard error of the means from three independent biological replicates (C, E, F, H, I, J).
