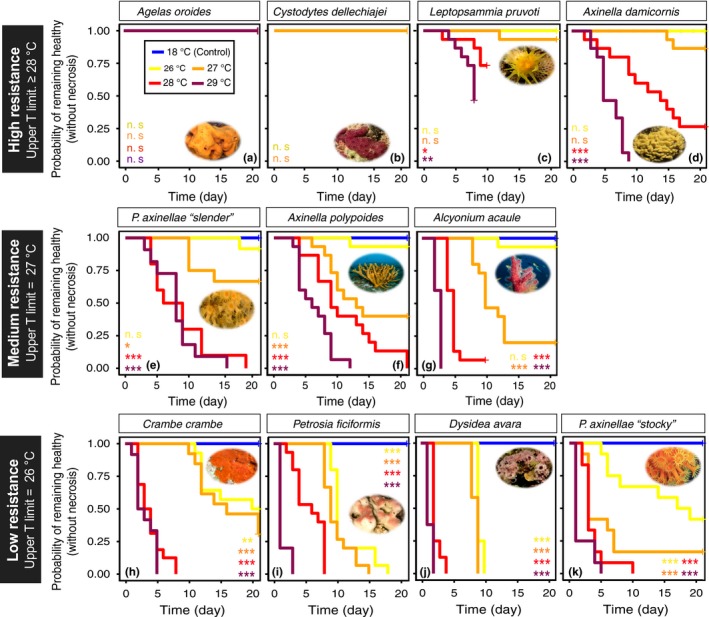
Figure 3.

Species‐specific Kaplan–Meier estimated survival curves (referred to as the probability of remaining necrosis‐free through time) for each species (a–k) exposed to the different experimental conditions. For C. dellechiajei, only the 18, 26, and 27°C treatments are represented. Furthermore, regarding the species tested in 2012 at 28 and 29°C (whose treatments only lasted 10 and 8 days, respectively; c, g, h, i, j), only these two periods were considered for statistical comparisons at these temperatures. The significance levels of the differences between the control (18°C) and each of the treatments (26, 27, 28 and 29°C) are represented for each species, as follows: ***p‐value <0.001, **p‐value <0.01, *p‐value <0.05 and ns: not significant. Finally, the species have been classified in different groups of resistance according to their upper T (thermal) limit (considered here as the first temperature at which a given species presents a lower probability of remaining healthy throughout the experiment compared to the control conditions)
