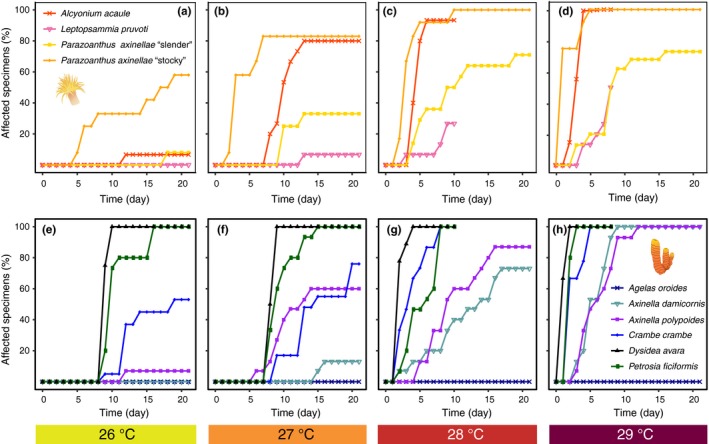
Figure 4.

Temporal development of the percentage of affected specimens in the studied cnidarian (above: a, b, c, and d) and porifera (below: e, f, g and h) species for every temperature treatment (26°C, 27°C, 28°C and 29°C) throughout the 21 days of exposure to thermal stress. Each species is represented by a different colored line, and the temperature treatments are represented by different colored boxes. Since all of the control specimens remained healthy without signs of necrotic tissue throughout the experimental period, the control is not represented. *For species tested in 2012, the two warmest treatments (28 and 29°C) lasted only 10 and 8 days, respectively
