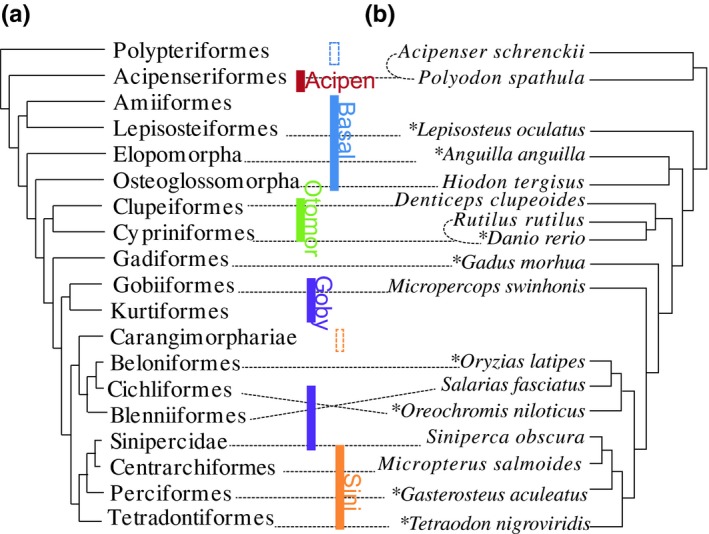
Figure 1.

(a) Phylogenetic relationships among 21 groups of ray‐finned fish (Betancur et al., 2013; Hughes et al., 2018). The vertical bars indicate different projects carried in the author's laboratory. The unfilled vertical bars indicate groups that captured <3,000 loci. (b) Maximum likelihood tree of 17 representative ray‐finned fishes based on 4,434 exon loci, all nodes have a 100 bootstrap value. The connected dotted lines between two trees indicate the corresponding taxa. Eight species names marked with stars indicate the fishes used in finding the target markers
