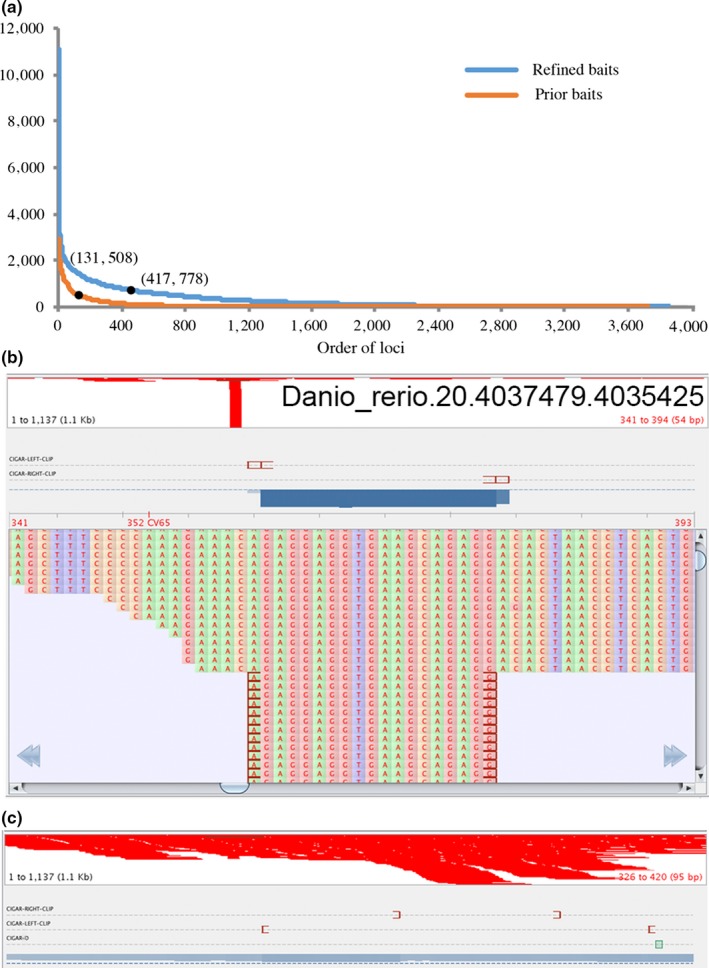
Figure 3.

Comparison on evenness of read coverage between results of gene capture using the baits designed a priori (a, blue curve) and the baits refined posteriorly (a, orange curve). (b, c) are screenshots from visualizing the read depth of the locus Danio_rerio.20.4037479.4035425 using Tablet v1.16.09.06. In this example, the result using baits designed a priori (b) is much worse than the result using refined baits (c)
