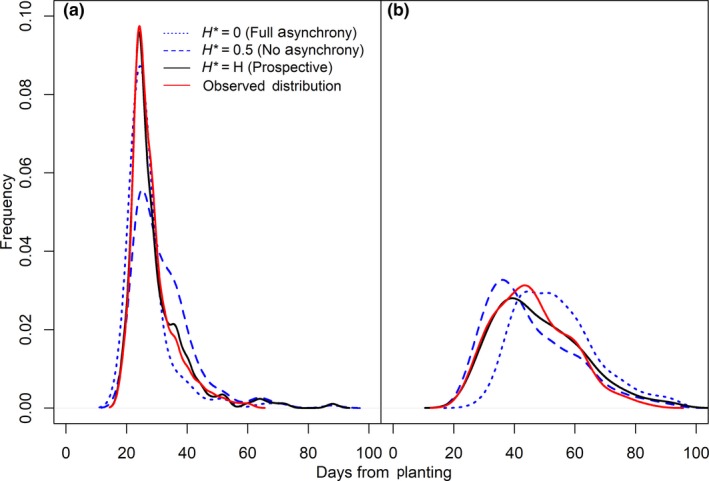
Figure 4.

Example synthetic mixture distributions of purebred and hybrid flowering times for resident (a) and migrant (b) flowering lines in the greenhouse experiment. Plotted are the zero hybridization (H* = 0) and 50% hybridization (H* = 0.5) mixtures, the mixture predicted from the prospective estimate (H), and the mixture which best fits the progeny flowering time distribution (Observed Distribution)
