Figure 9.

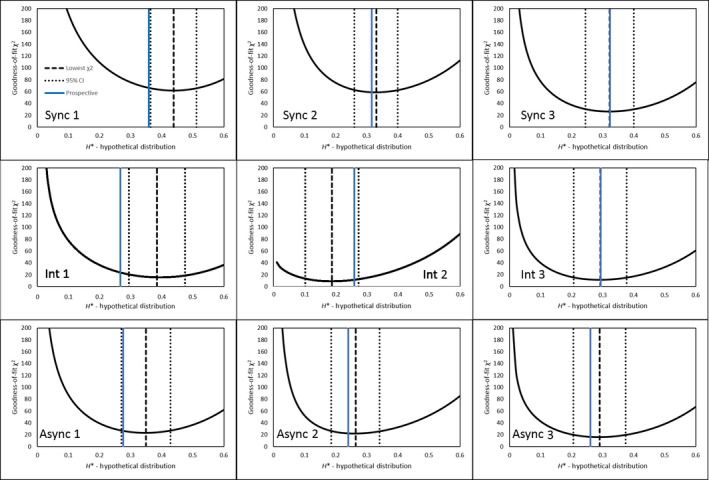
χ2 goodness‐of‐fit distributions for migrants from each experimental plot with the hybridization value at the minimum χ2, confidence intervals, and prospective estimate plotted. Plot number is in the top left

χ2 goodness‐of‐fit distributions for migrants from each experimental plot with the hybridization value at the minimum χ2, confidence intervals, and prospective estimate plotted. Plot number is in the top left