
Figure 3.
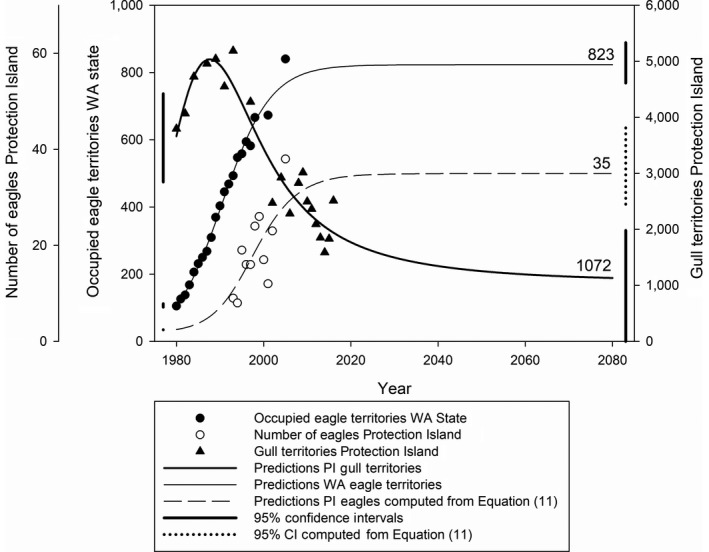
Observed data and model predictions. Observed data (symbols) and predictions of models (2) and (11) from 1980 to 2080 (curves) are numbers of occupied bald eagle territories in Washington State (solid circles, light solid curve), numbers of bald eagles observed at Protection Island, Washington (open circles, dashed curve), and numbers of glaucous‐winged gull nests at the Violet Point colony on Protection Island (triangles, dark solid curve). The 95% confidence intervals for fitted initial conditions and predicted equilibria are marked with vertical lines on the left‐ and right‐hand sides of the graph, respectively