
Figure 2.
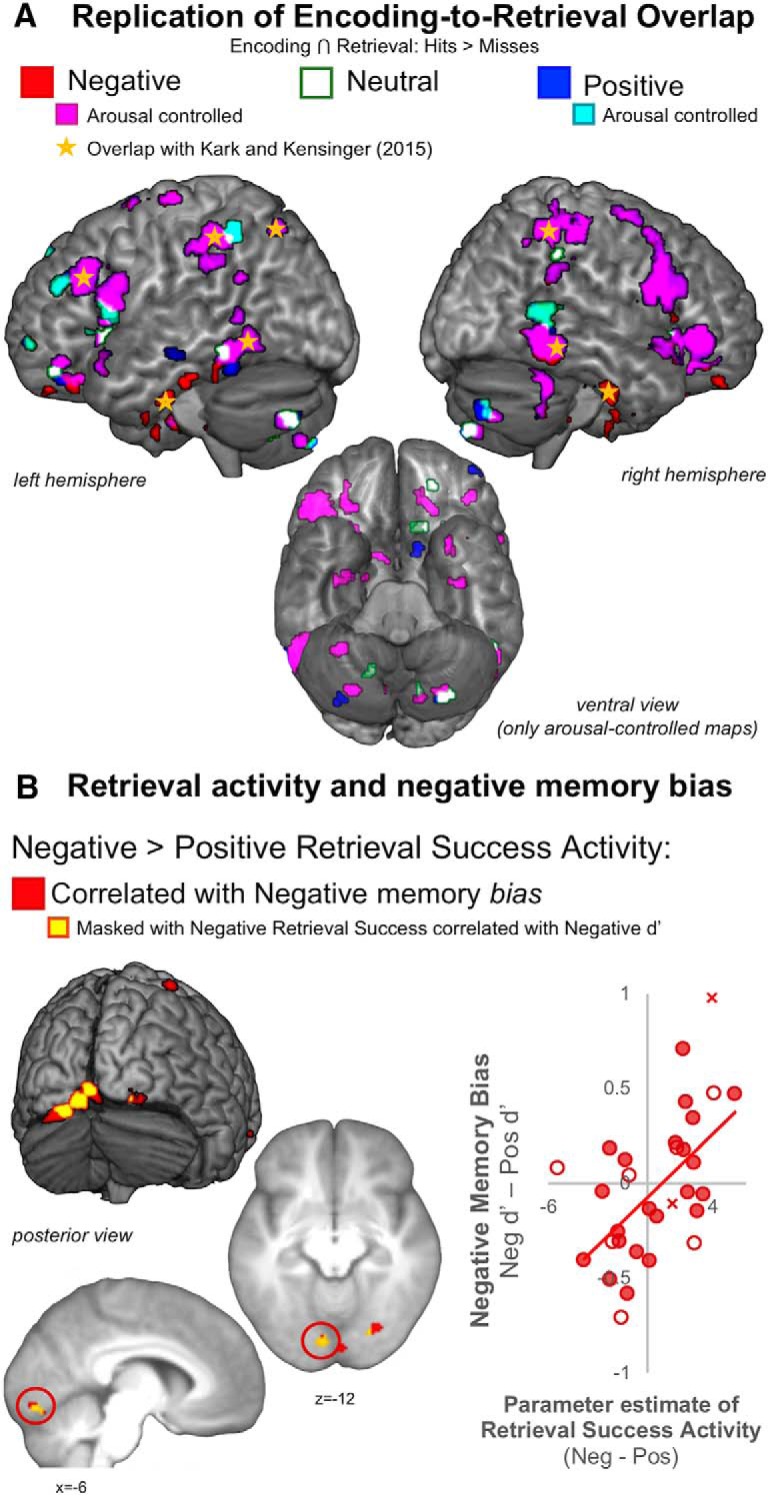
A, Replication of group-level whole-brain encoding-to-retrieval overlap effects for negative stimuli are plotted in red, with regions that directly overlap with clusters from our prior study (Kark and Kensinger, 2015) demarcated using yellow star symbols. Regions that survived controlling for item-level subjective arousal from the post-scan ratings are shown in magenta for negative memories and cyan for positive memories. B, Whole-brain correlations between individual differences in Negative > Positive Retrieval Success Activity and negative memory bias are shown in red, with yellow areas to identify clusters that also show a correlation between Negative Retrieval Success and Negative d′ (inclusive masking technique thresholded at a p < 0.05). Individual data points from a cluster spanning the left calcarine sulcus and lingual gyrus (circled in red in the sagittal and axial slices) are visualized in a scatter plot (bottom right). The scatted plot contains filled circles representing the n = 22 participants included in the whole-brain analyses, but also open circles that represent the data for the seven participants excluded from the whole-brain retrieval analysis who might have noisier estimates of retrieval success activity because of a low number of misses. The red X's represent the n = 2 participants who were not included in any of the group task or RSFC analyses but are plotted to observe how the pattern might extend if these participants were included in analysis.