
Figure 3.
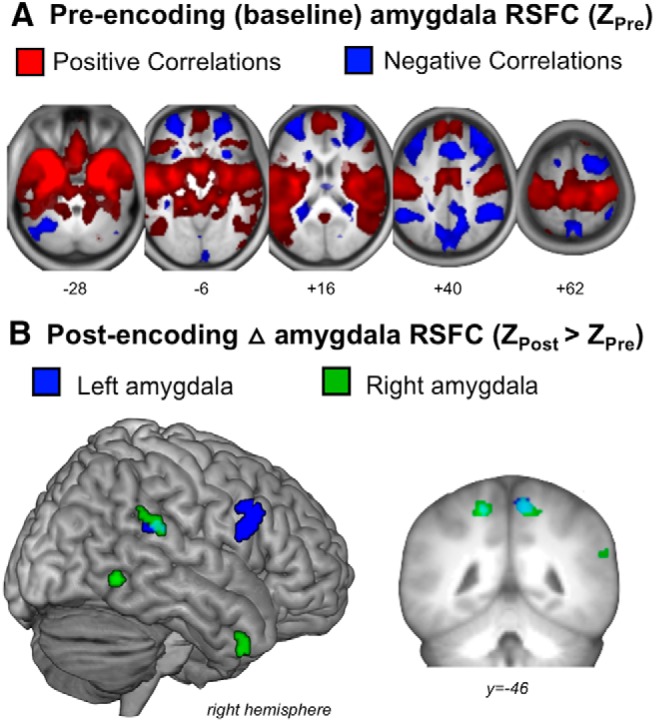
A, Group-average amygdala RSFC during pre-encoding (baseline) replicates a typical widespread pattern of positive correlations (red) and anti-correlations (blue). B, Depicts the group-level pre- to post-encoding increases in left (blue) and right (green) amygdala RSFC. Overlap between the left and right amygdala maps in the precuneus are shown in cyan.