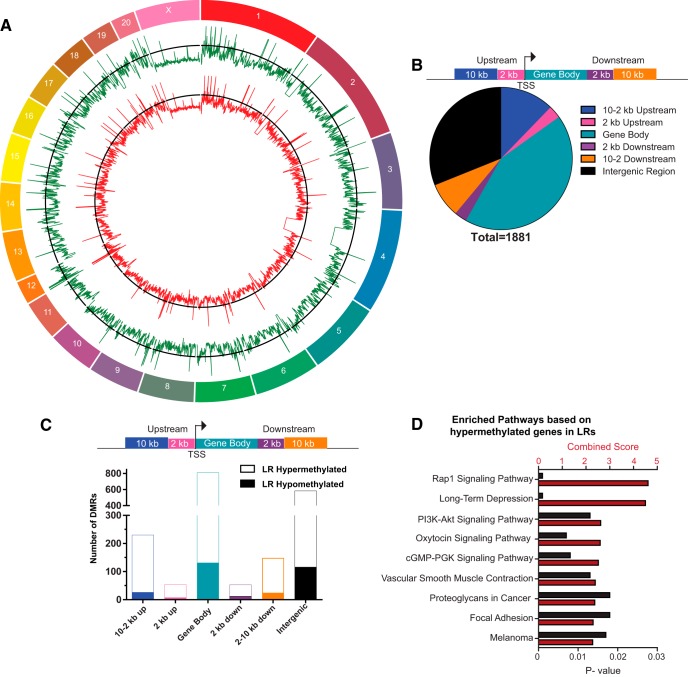
Figure 2.
The distribution of HR versus LR methylation differences across standard genomic structures. A, Using MEDIPS (statistically filtering using edgeR, p < 0.05 with Bonferroni correction), 1881 DMRs were identified in the HR/LR postnatal day 7 amygdala samples. The genome-wide distribution of methylated sites is shown through a circle plot with average HR (green) and average LR (red) methylation. B, Diagram represents standard genomic regions where we examined potential HR/LR methylation difference. Pie chart represents the number of DMRs upstream and downstream of genes, within gene bodies and in intergenic regions. C, DMRs were grouped to show the number of sites that were hypomethylated in LR versus HR samples (solid bars) and those that were hypermethylated in LR versus HR (open bars) across different genomic regions. D, KEGG analysis was used to identify functional pathways enriched with genes that were hypermethylated in LR versus HR amygdala samples. Here, combined enrichment score is shown on the top x-axis and is represented by red bars. The p value of each pathway enrichment is shown on the bottom x-axis and is represented by black bars. All sample sizes were 4 per group. TSS = transcriptional start site.

