Figure 3.
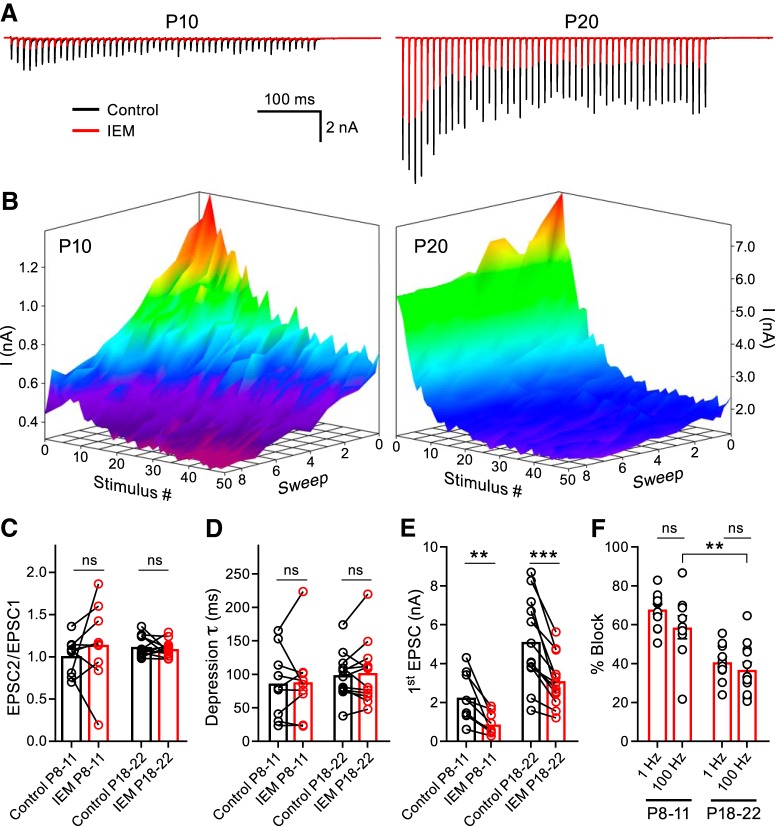
CP-AMPARs do not regulate STP. A, EPSC trains evoked by midline stimulation at a frequency of 100 Hz were recorded in control conditions (black) and after application of IEM-1460 (red). Representative traces are displayed for a P10 (left) and a P20 (right) animal. External Ca2+ is 1.2 mm. B, Ten sweeps (z-axis) of stimulation at 100 Hz (50 stimuli - x-axis) every 10 s yield EPSCs with peak amplitudes (y-axis) displayed as surface plots for representative P10 and P20 recordings. The control condition (shown as sweep 1) was an average of ≥3 trains. The surfaces are pseudo-colored depicting red for greater amplitudes and purple for smaller. Note the greater block by IEM-1460 in each successive sweep compared with the control at P10, but not at P20. C, D, Summary of paired-pulse ratio (paired t test; P8–P11: n = 9, p = 0.2554; P18–P22: n = 12, p = 0.4875) and τ (paired t test; P8–P11: n = 9, p = 0.9521; P18–P22: n = 12, p = 0.8049) before and after application of IEM-1460. E, Summary data of the first EPSC amplitude block by IEM-1460 (paired t test P8–P11: n = 9, p = 0.0036; P18–P22: n = 12, p = 0.0003). F, First EPSC percentage block is stronger in the P8–P11 group than in the P18–P22 group using the 100 Hz blocking protocol (unpaired t test; P8–P11: n = 9; P18–P22: n = 12; p = 0.0044). Additionally, the effect of IEM-1460 on EPSC percentage block is similar using either the 1 Hz (from Fig. 1D) or 100 Hz stimulation paradigms in both age groups (unpaired t test P8–P11: p = 0.1339; P18–P22: p = 0.4171). ns, nonsignificant, **p < 0.005, ***p < 0.001.

