Figure 6.
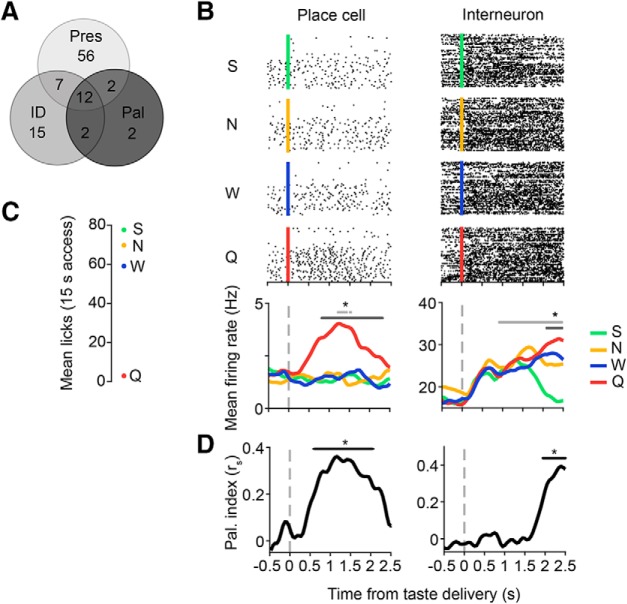
Example hippocampal responses to different elements of the taste experience. A, Summary of the number of taste-responsive cells (n = 96/482 cells) that responded to taste presence (Pres, n = 77 cells), identity (ID, n = 36 cells), and/or palatability (Pal, n = 18 cells). B, Example raster plots and PSTHs from a taste-responsive place cell (left) and interneuron (right). Black dots in the raster plots (top four panels) represent spike times during each trial, aligned to taste delivery time (S, green line, 4 mm saccharin; N, yellow line, 100 mm sodium chloride; W, blue line, distilled water; Q, red line, 5 mm quinine hydrochloride). Each colored trace in the PSTHs (bottom) represents the mean firing rate to one of the four tastes, smoothed with a 1D Gaussian filter (σ = 5 ms). Light gray lines indicate periods of significant responses to taste presence, whereas dark gray lines indicate periods of significant responses to taste identity (*p < 0.05, t tests on successive time windows). C, Relative palatability of the four taste stimuli as determined by a BAT. Palatability rank is determined by the average number of licks per 15 s of exposure to the given taste. D, Rank-order correlation (rs) between the taste-evoked firing rates and palatability rank (S > N > W > Q) for the place cell (left) and interneuron (right) depicted in B. Black lines indicate periods of significant palatability relatedness (*p < 0.05, t tests on successive time windows). Note the similarity between the timing of palatability- and identity-related responses (dark gray lines in B).

