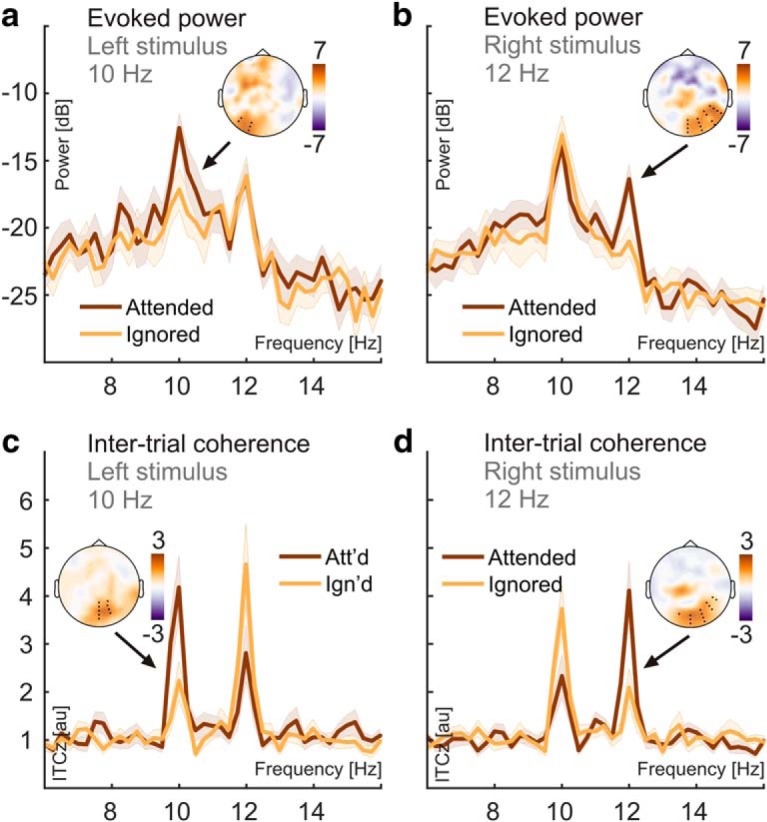
Figure 4.

Attention effects on SSR evoked power and SSR intertrial phase coherence. a, SSR evoked power spectra show systematic power differences at the presentation frequency (10 Hz) of the left stimulus when it was attended (dark red) versus ignored (orange). Shaded areas indicate standard errors of the mean. The inset scalp map illustrates the topographical distribution of the attention effects. Power spectra were averaged across electrodes (black dots in scalp maps) that showed consistent attention effects in group statistics (two-tailed cluster-based permutation tests) for attended and ignored conditions separately. b, Same as in a but for the 12 Hz stimulus presented in the right visual hemifield. c, d, Same as in a and b but using ITCz as a measure of SSR intertrial phase coherence.
