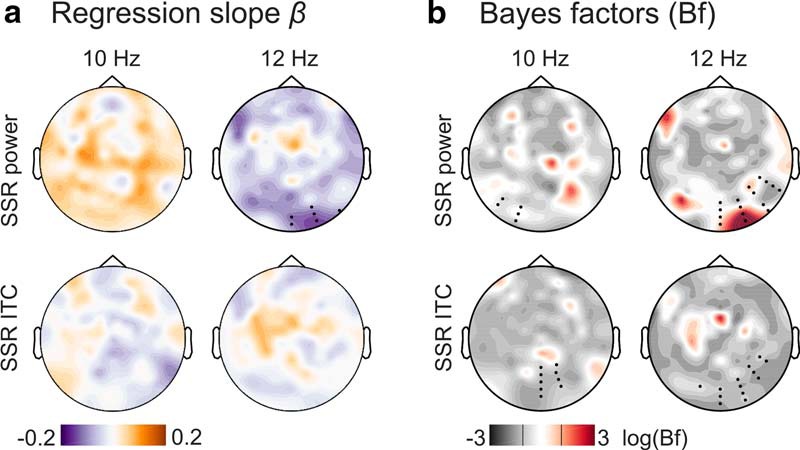
Figure 6.

Summary of subject-level analysis of the linear relationship between alpha power and SSR attentional modulation. a, The topographical distribution of group-averaged (N = 17) regression coefficients β (slopes) for SSR evoked power (top row) and SSR intertrial coherence (ITC, bottom row), separated by SSR frequencies of 10 Hz (left column) and 12 Hz (right column). Hot colors indicate a positive linear relationship, and cool colors a negative relationship. Black dots in the top right panel indicate a cluster of electrodes showing a systematic effect (p < 0.05, cluster-based permutation test) absent in tests illustrated in the other three panels. b, Results of sensor-by-sensor group-level Bayesian inference (Bayesian t tests) of regression slopes against zero, plotted as topographies on a log(BF10) scale. Plots arranged as in a. Red colors indicate stronger evidence for H1, and gray colors indicate stronger evidence for H0. Black lines in the color scale below scalp maps denote thresholds that signal moderate evidence for H0 (log(1/3) = −1.099) or H1 (log(3) = −1.099) by convention. Superimposed black dots indicate clusters showing systematic attention effects on SSR evoked power/ITC as depicted in Figure 4 for comparison.
