Figure 3.
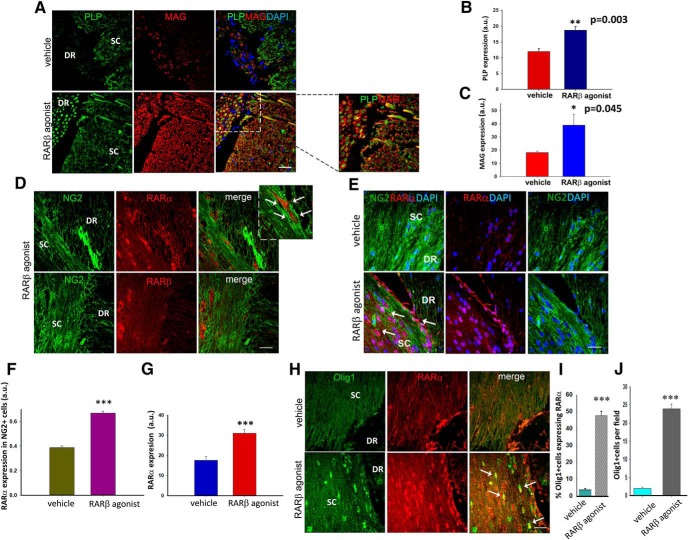
RARα-mediated myelination in RARβ-agonist-treated avulsed rats. A, Expression of both PLP and MAG are upregulated in the RARβ-treated rats and both types of myelin show an unbroken pattern (inset). B, C, Quantification of PLP and MAG shows a significant increase in response to RARβ treatment. Data show mean ± SEM, n = 8 per treatment group, **p ≤ 0.01, Student's t test. D, RARα, but not RARβ, is upregulated in NG2+ cells in the dorsal horn of RARβ-agonist-treated rats (see arrows). E, Expression of RARα and NG2 in vehicle- and RARβ-agonist-treated rats shows an upregulation of RARα in the nucleus (seen in dark pink and indicated with white arrows) in C286-treated rats. F, G, Quantification of RARα in NG2 cells is significantly higher in this group (F) as is the total RARα expression (G) compared with vehicle-treated rats. Data are shown as mean ± SEM, n = 8 per treatment, ***p ≤ 0.001, Student's t test. H–J, There is a high coexpression of Olig1 and RARα in RARβ-agonist-treated rats (H), with the percentage of Olig1+ cells expressing RARα (I) being significantly higher in this group compared with vehicle-treated rats, as is the total number of Olig1+ cells per field (J). Data are shown as mean ± SEM, n = 8 ***p ≤ 0.001, Student's t test. Scale bars, 100 μm.

