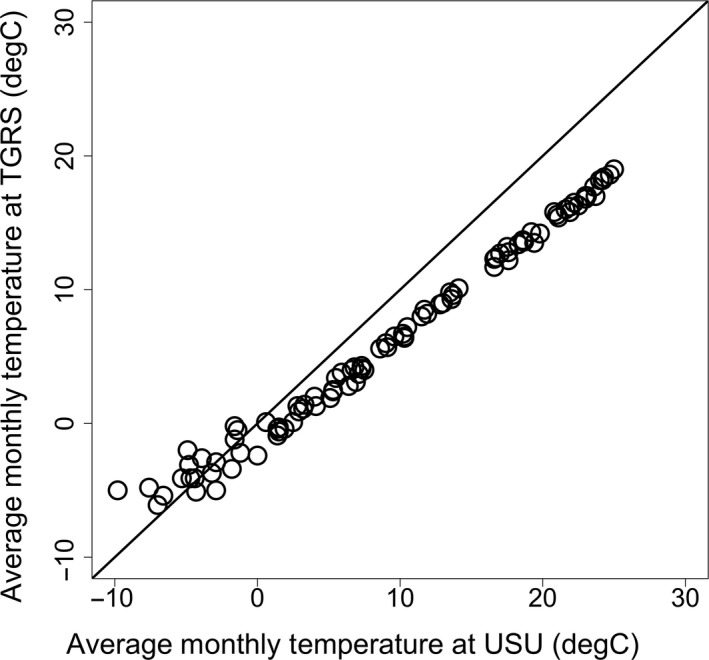
Figure A1.

Relationship between TGRS and USU average monthly temperatures from 2009 to 2016 (R 2 = 0.9882; p‐value <0.001; Pearson product‐moment correlation = 0.994)

Relationship between TGRS and USU average monthly temperatures from 2009 to 2016 (R 2 = 0.9882; p‐value <0.001; Pearson product‐moment correlation = 0.994)