Figure 7.
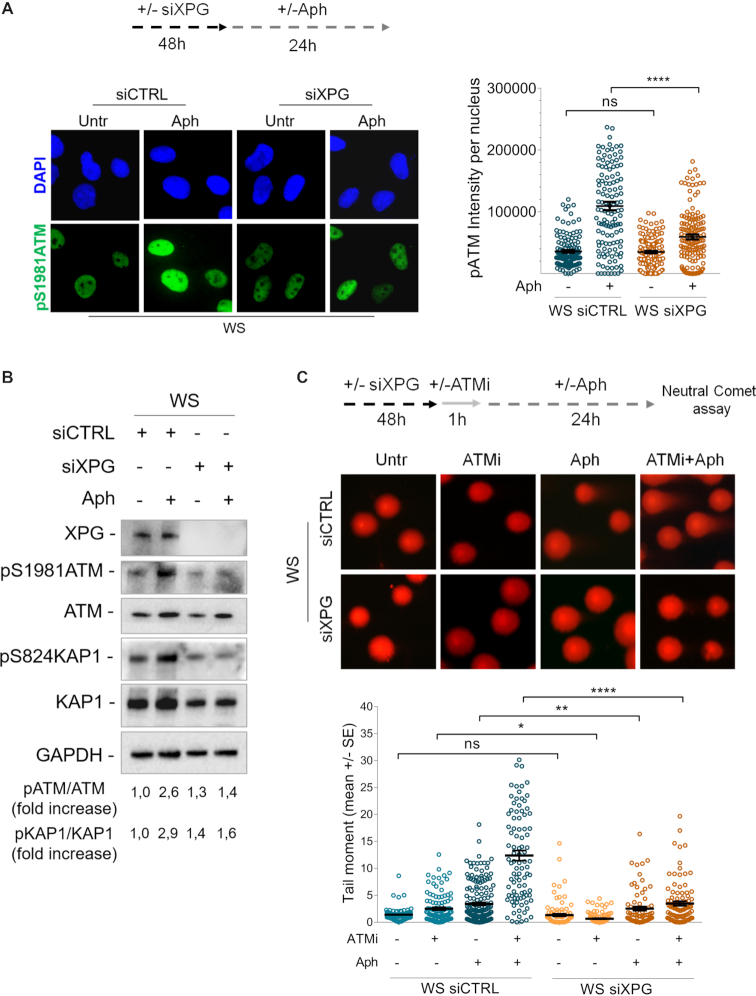
XPG-dependent processing of R-loops leads to ATM activation in WS cells. (A) Evaluation of ATM activation upon XPG depletion by immunofluorescence. Werner syndrome (WS) cells were transfected with control siRNAs (siCTRL) or siRNAs directed against XPG (siXPG). After 48 hours cells were treated as reported in the experimental scheme. Immunostaining was performed with an anti-pATM (S1981) antibody. Representative images are given. Dot plot shows pATM intensity per nucleus from three independent experiments. Horizontal black lines represent the mean ± SE. (ns, not significant; ****P < 0.0001; two-tailed Student's t test). (B) Western blot analysis of ATM, KAP1 activation in total extracts of WS cells depleted of XPG and treated as reported in the experimental design. Expression levels of XPG were determined by immunoblotting with anti-XPG antibody. The presence of activated, i.e. phosphorylated, ATM or KAP1 was assessed using anti-pATM (S1981) or anti-pKAP1 (S824) antibody. Total amount of ATM or KAP1 was determined with anti-ATM or anti-KAP1 antibody. Anti-GAPDH antibody was used as loading control. The fold increase with respect to the WS untreated of the normalised ratio of the phosphorylated ATM/total ATM or KAP1/total KAP1 is reported for each cell line. Representative gel images of at least three replicates are shown. (C) Analysis of DSB accumulation by neutral Comet assay. WS cells depleted of XPG and in which ATM is inhibited were treated as reported by the experimental scheme, and then subjected to neutral Comet assay. Representative images are given. Dot plot shows data presented as mean tail moment ± SE from three independent experiments. Horizontal black lines represent the mean. (ns, not significant; *P < 0.1; **P < 0.01; ****P < 0.0001; two-tailed Student's t test).

