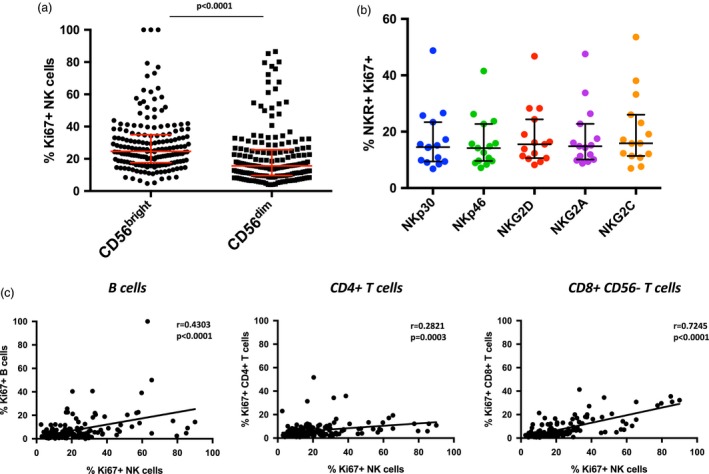
Figure 2.

The distribution of Ki67+ cells in systemic lupus erythematosus (SLE). (a) Scatter‐plot of the frequency of Ki67+ CD56bright (n = 174, median = 24·7) and CD56dim (n = 174, median = 15·7). Middle bar denotes median; surrounding bars denote first and second interquartile ranges. (b) Scatter‐plot of the percentage of the indicated natural killer receptor (NKR) expressing Ki67 in SLE (n = 15) and healthy donors (HD) (n = 5). Middle bar denotes median; surrounding bars denote first and second interquartile range. Statistical tests for (a) and (b) performed using the Mann–Whitney U‐test. (c) Linear regression analyses of Ki67+ NK cells with the indicated lymphocyte populations. Statistical analyses performed using Pearson’s correlation. CD8+CD56+ cells could not be analyzed because of overlap with NK cells.
