Figure 6.

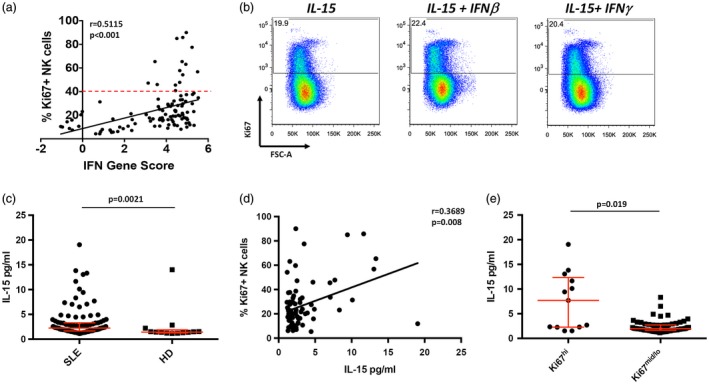
High frequencies of Ki67+ natural killer (NK) cells correlate with a type I interferon (IFN) gene signature and serum interleukin (IL)‐15 levels. (a) Linear regression analysis of IFN gene score with percentage of Ki67 + NK cells in systemic lupus erythematosus (SLE) patients. Statistical analysis was performed using Spearman’s ranked correlation. Dashed line indicates 1 standard deviation (s.d.) from mean (40%). (b) Flow cytometry dot plots of peripheral blood NK cells cultured with the indicated stimuli. Data are representative of four individual healthy donors (HD). Cells shown are NK cells within the viable lymphocyte gate. (c) Scatter‐plot analysis of serum IL‐15 levels. Serum concentrations of IL‐15 in SLE (n = 105, median = 2·24) and HD (n = 13, median = 1·43). Middle bar denotes mean; surrounding bars denote first and second interquartile ranges. Statistical analyses performed using the Mann–Whitney U‐test. (d) Linear regression analysis of serum IL‐15 levels with percentage of Ki67+ NK cells in SLE patients. Statistical analysis was performed using Pearson’s correlation. (e) Serum IL‐15 levels in SLE patients in Ki67hi and Ki67mid/lo NK cell groups.
